76% of marketing leaders say measuring influencer marketing performance is their biggest challenge, yet the problem isn’t a lack of data — it’s tracking the wrong metrics. Brands that still evaluate creators by follower count and likes are optimizing for vanity while their competitors optimize for revenue.
This guide is part of our Influencer Marketing ROI: The Complete Guide to Measuring, Tracking & Proving Results — a comprehensive resource for brands looking to build effective creator partnerships at scale.
The influencer marketing KPIs that matter in 2026 look fundamentally different from those that dominated five years ago. The industry has matured past awareness-only measurement into a sophisticated performance discipline with clear metrics at every stage of the funnel — from discovery to conversion to customer lifetime value.
This guide provides the definitive set of KPIs that modern brands should track across their influencer programs, with benchmarks, formulas, and practical guidance on building measurement infrastructure that drives better decisions. For the complete measurement framework, see our comprehensive influencer marketing ROI guide.
In this guide, you’ll learn:
- The KPIs that actually predict influencer marketing success
- How to measure awareness, engagement, and conversion separately
- Benchmarks for every major KPI by industry and creator tier
- How to build an influencer marketing measurement dashboard
- Advanced KPIs for mature programs
- Common measurement mistakes to avoid
Table of Contents
- Awareness KPIs
- Engagement KPIs
- Conversion and Revenue KPIs
- Efficiency and ROI KPIs
- Advanced KPIs for Mature Programs
- Building Your KPI Measurement Dashboard
- Start Measuring What Matters
- Frequently Asked Questions
Awareness KPIs
Awareness metrics measure how effectively your influencer content reaches your target audience. While they shouldn’t be your primary success metrics, they provide essential context for understanding the top-of-funnel impact of your creator programs.
Reach and Impressions
Reach measures the number of unique users who saw your creator content. Impressions measure total views including repeat exposures. Both are important, but reach is more meaningful for awareness objectives because it tells you how many distinct people encountered your brand.
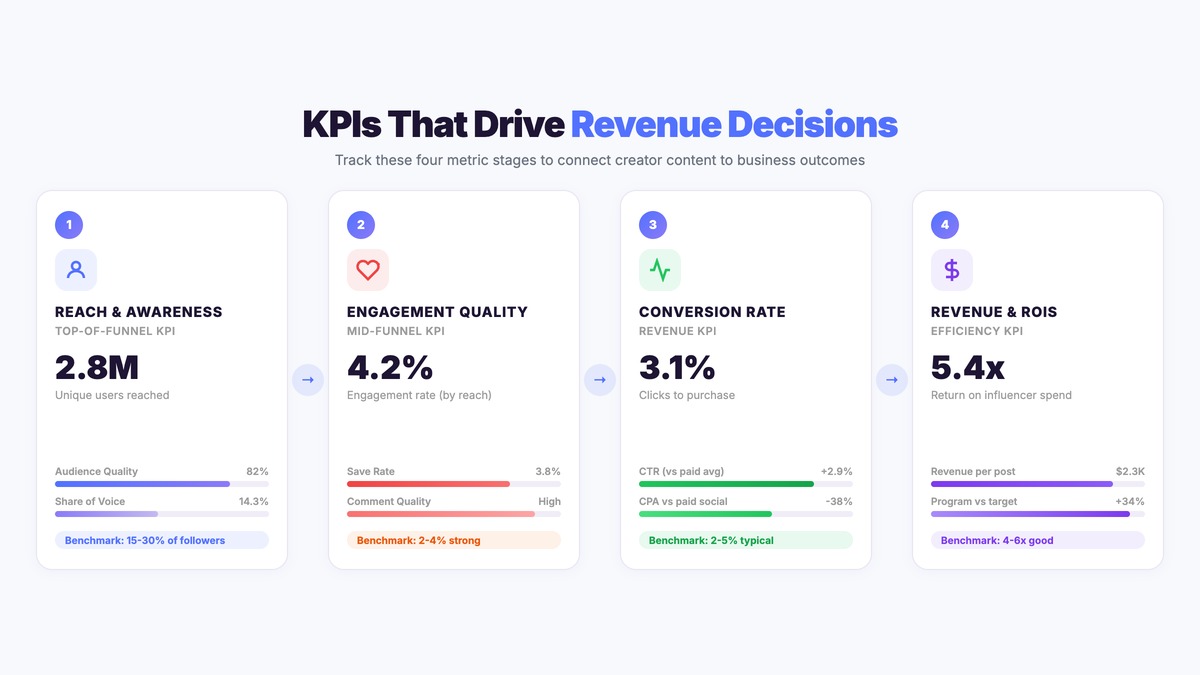
Benchmarks: Expect to reach 15-30% of a creator’s follower base per post on Instagram, 40-80% on TikTok (due to algorithmic distribution beyond followers), and 10-20% on YouTube for established channels. These percentages vary significantly by creator engagement quality.
Share of Voice (SOV)
SOV measures your brand’s visibility relative to competitors within creator content. Track the volume of creator mentions, posts, and engagement your brand receives versus key competitors. Increasing SOV over time correlates with market share growth — brands that consistently maintain higher SOV than competitors grow share faster. For more on this topic, explore our affiliate influencer marketing playbook.
Branded Search Lift
One of the most valuable awareness KPIs: the increase in people searching for your brand name following creator campaigns. Use Google Trends, Search Console, or SEMrush to measure branded search volume before, during, and after campaigns. A meaningful branded search lift (15%+) indicates that creator content is successfully moving audiences from passive viewing to active interest. For more on this topic, explore our State of Influencer Marketing 2026 report.
Audience Quality Score
Audience Quality Score measures the composition and relevance of a creator’s audience, not just its size. Track these dimensions:
- Demographic alignment: What percentage of the creator’s audience matches your target customer profile (age, gender, location, income)?
- Authenticity ratio: The percentage of real, active followers versus bot or inactive accounts
- Category affinity: How many followers actively engage with content in your product category
- Purchase intent signals: Follower behavior indicating readiness to buy (saves, product tag clicks, link-in-bio visits)
Benchmarks: Audience quality scores above 70% indicate strong alignment; below 50% suggests the creator’s audience may not convert well regardless of engagement rates. Many brands find that a mid-tier creator with 85% audience quality outperforms a macro creator with 45% audience quality on conversion metrics.
Engagement KPIs
Engagement metrics indicate how deeply audiences interact with creator content featuring your brand. High engagement signals genuine interest rather than passive scrolling. For more on this topic, explore our AI-powered creator matching.
Engagement Rate
The most common engagement metric: total engagements (likes + comments + shares + saves) divided by reach or followers. However, not all engagement is equal. A save or share indicates significantly higher intent than a like. Weight your engagement calculations accordingly: saves and shares are 3-5x more valuable than likes as purchase intent signals. For more on this topic, explore our essential guide to creator commerce.
Benchmarks by platform: Instagram 1.5-3% (good), 3-6% (excellent). TikTok 3-6% (good), 6-15% (excellent). YouTube 2-5% (good), 5-10% (excellent based on like-to-view ratio).
Comment Quality and Sentiment
Beyond counting comments, analyze their content. Comments asking “where can I buy this?” or “does this come in other colors?” signal purchase intent. Comments saying “love this!” are nice but less commercially valuable. Track the ratio of high-intent comments (purchase questions, product questions, tagging friends) to general positive comments. High-performing creator content generates 15-25% high-intent comments.
Save Rate
Content saves are the strongest engagement signal for future purchase intent. Users save content they plan to return to — often when they’re ready to buy. Track save rates by creator and content format to identify which approaches generate the highest commercial intent. Benchmark: 1-3% save rate is good, 3-5% is excellent.
Share Rate
Shares extend your content’s reach organically and represent the highest form of audience endorsement. When a viewer shares creator content featuring your product, they’re personally recommending your brand to their network. Track shares as a percentage of reach and identify content formats that drive the highest share rates.
Conversion and Revenue KPIs
Conversion KPIs directly measure the business impact of your influencer program. These should be the primary metrics driving budget allocation and creator selection decisions.
Click-Through Rate (CTR)
The percentage of people who saw creator content and clicked through to your website or product page. CTR bridges awareness and conversion — high CTR indicates effective calls-to-action and genuine purchase interest. Benchmark: 1-3% CTR is average for influencer content; 3-5% is strong; above 5% is exceptional.
Conversion Rate
Of those who click through, what percentage complete a purchase? Track this by creator, content format, and platform. Creator-driven traffic typically converts at 2-5% (comparable to organic search) versus 1-2% for paid social — reflecting the trust advantage of creator endorsements.
Revenue Per Post
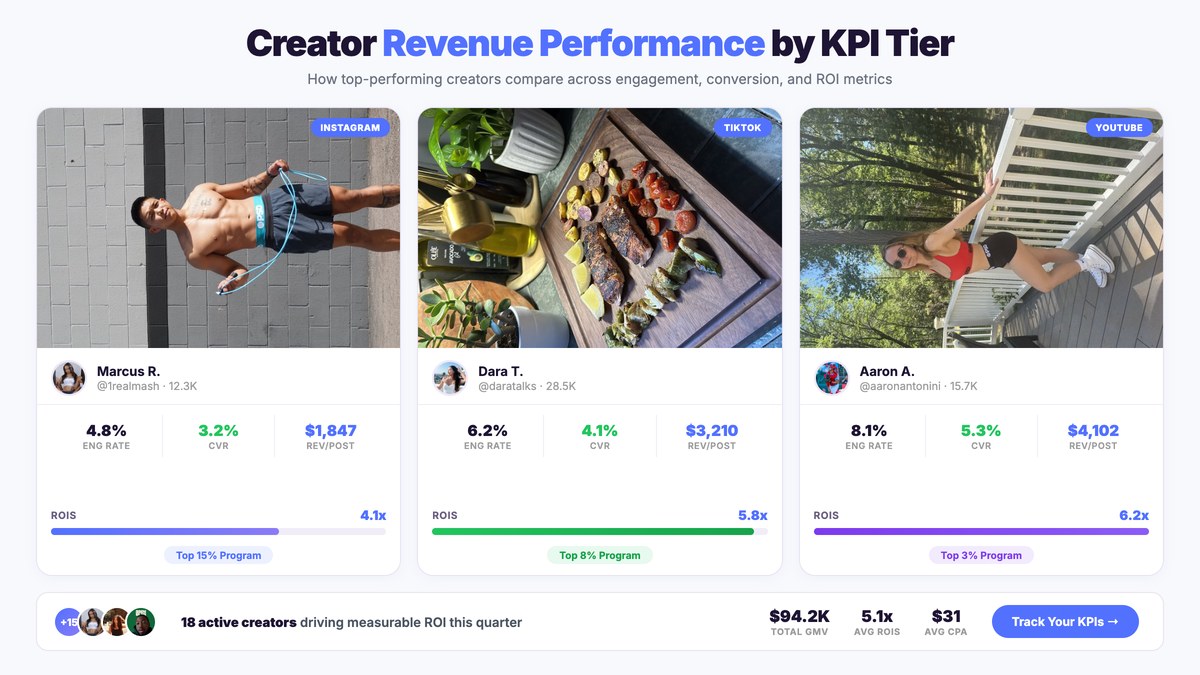
Total attributed revenue divided by the number of creator posts. This metric enables direct performance comparison across creators regardless of their compensation structure. A creator paid $2,000 per post who generates $10,000 in revenue per post is more valuable than a creator paid $500 who generates $1,500 — even though the second creator has a higher percentage return.
Cost Per Acquisition (CPA)
Total influencer program cost divided by the number of customers acquired. Compare your influencer CPA to other channels (paid social, search, email) to determine optimal budget allocation. Influencer CPA typically ranges from $15-$50 for consumer products and $50-$150 for higher-consideration purchases.
Platforms like partnrUP provide unified dashboards that track all these conversion KPIs across creators, platforms, and campaigns — giving brands real-time visibility into what’s driving revenue.
Efficiency and ROI KPIs
Efficiency metrics help you optimize spending and identify where to invest more — or less.
Return on Influencer Spend (ROIS)
The ratio of revenue generated to total influencer investment. Formula: Total Attributed Revenue / Total Influencer Spend. Industry benchmark: 4-6x return ($4-$6 revenue per $1 spent) is good, 8-12x is excellent. Track ROIS by creator tier, platform, and content format to identify your most efficient investment areas.
Cost Per Engagement (CPE)
Total spend divided by total engagements. While engagement alone doesn’t drive revenue, CPE helps compare the relative efficiency of different creators and campaigns at generating audience interaction. Benchmark: $0.10-$0.50 CPE is typical; under $0.10 indicates exceptional value.
Content Efficiency Ratio
Measure the value of content beyond its initial posting. Track how creator content performs when repurposed as paid ads, used on product pages, or featured in email marketing. High-performing creator content often generates 3-10x its initial value through repurposing — a factor most ROI calculations miss entirely.
Creator Retention Rate
What percentage of your creators participate in more than one campaign? High retention indicates program health — creators who want to continue working with your brand are likely producing authentic, effective content. Programs with creator retention above 60% consistently outperform those with high turnover. Track retention and investigate why creators leave when they do.
Ready to build a KPI-driven influencer program? Book a demo with partnrUP to see how brands track, optimize, and scale their creator marketing performance.
Advanced KPIs for Mature Programs
Once your basic measurement infrastructure is in place, these advanced KPIs provide deeper strategic insight.
Customer Lifetime Value (LTV) by Acquisition Source
Compare the LTV of customers acquired through influencer marketing versus other channels. If influencer-acquired customers have meaningfully higher LTV (common finding: 15-25% higher), this should factor into your willingness to pay higher CPAs for influencer-driven customers. Tools like partnrUP’s platform help brands automate this at scale.
Incrementality Rate
What percentage of influencer-driven sales are truly incremental — meaning they would not have occurred without the creator content? Measure through geo-based holdout tests or audience experiments. Most brands find 30-60% incrementality, meaning a significant portion of attributed sales are genuinely new revenue.
Brand Sentiment Shift
Track changes in brand sentiment (positive, neutral, negative mentions) during and after influencer campaigns using social listening tools. Effective influencer programs should measurably shift sentiment in a positive direction. If campaigns generate mixed or negative sentiment, the creator selection or messaging strategy needs adjustment.
Earned Media Value (EMV)
While EMV is imperfect, it provides a useful benchmark for the reach and engagement your influencer program generates relative to paid media equivalents. Calculate EMV by multiplying impressions by CPM rates and engagements by CPE rates for paid media in the same vertical. Use EMV as a directional comparison, not an absolute performance measure.
Building Your KPI Measurement Dashboard
Tracking the right influencer marketing KPIs requires building measurement infrastructure before you launch campaigns. Here’s how to structure your dashboard for actionable insights.
The Three-Tier KPI Framework
Organize your KPIs into three reporting tiers based on decision-making needs:
- Daily operational metrics: Story views, link clicks, promo code redemptions — for campaign optimization in real time
- Weekly performance metrics: Engagement rate, CTR, conversion rate, revenue per post — for creator performance review and content optimization
- Monthly strategic metrics: ROIS, CPA vs. other channels, creator LTV, audience quality drift — for budget allocation and program strategy decisions
Essential Data Integration Points
A complete influencer marketing measurement dashboard pulls from five data sources:
- Platform analytics: Instagram Insights, TikTok Analytics, YouTube Studio for reach, impressions, and engagement by post
- UTM tracking: Custom URLs per creator to attribute website traffic and session behavior in Google Analytics
- Promo code redemptions: Direct attribution for purchases driven by creator content — the most reliable conversion signal
- Pixel-based attribution: View-through and click-through attribution via Meta Pixel, TikTok Pixel for multi-touch measurement
- CRM integration: Connecting creator-acquired customers to long-term LTV data for ROI optimization at the program level
Common KPI Measurement Mistakes
Most brands make at least one of these measurement errors that skews their KPI data and leads to poor budget decisions:
- Using last-click attribution only: Creator content influences purchases that are completed via other channels — last-click attribution undervalues influencer impact by 40-60% in multi-touch studies
- Ignoring platform-specific benchmarks: An 8% engagement rate is exceptional on Instagram but average on TikTok — apply platform-calibrated benchmarks, not universal ones
- Measuring campaign-level KPIs only: Individual creator performance matters more than aggregate campaign numbers for roster optimization
- Skipping post-campaign analysis: Content value compounds after initial posting through algorithm amplification, shares, and reuse as paid media
- Not tracking competitor benchmarks: Share of Voice metrics require monitoring competitor creator activity, not just your own
KPI Reporting Cadence
Structure your reporting to match decision-making timelines:
- Campaign live (days 1-3): Monitor story views, link clicks, and promo code redemptions daily to catch underperforming creators early
- Mid-campaign (week 2): Review engagement quality, CTR, and conversion rate — adjust posting times or content direction if needed
- Post-campaign (days 14-30): Measure final ROIS, CPA, and content efficiency once all attribution windows close
- Quarterly review: Analyze creator LTV, audience quality drift, incrementality, and sentiment shift for program-level strategy decisions
The most effective brands connect all these data streams in a single platform. partnrUP’s creator management platform integrates affiliate tracking, campaign analytics, and creator performance data in one dashboard — so your team spends time acting on insights, not compiling them. See how it works in a live demo.
Start Measuring What Matters
The gap between brands that treat influencer marketing as a scalable revenue channel versus brands that view it as an awareness expense comes down to measurement. The KPIs in this guide — from basic engagement rate to advanced incrementality measurement — give you the framework to know exactly what your creator program is generating and where to invest more.
Start with these three actions today:
- Audit your current tracking setup: Are you capturing UTMs, promo codes, and pixel attribution for every creator partnership? If not, close those gaps before your next campaign launches.
- Set benchmarks: Pull your last 6 months of influencer data and calculate your baseline ROIS, CPA, and engagement rates by creator tier. You need a baseline before you can optimize.
- Add one advanced KPI: If you’re only tracking awareness and engagement metrics, add one performance metric (revenue per post or CPA) to your next campaign and report on it explicitly in your post-campaign analysis.
For teams managing multiple creators and campaigns, the measurement infrastructure described in this guide quickly becomes complex to maintain in spreadsheets. partnrUP’s influencer marketing platform automates KPI tracking across your entire creator roster — connecting affiliate data, campaign analytics, and creator performance in one dashboard that makes the metrics above your daily operating reality, not quarterly reports.
For the complete framework on measuring and proving influencer marketing ROI — including attribution models, budget optimization, and measurement case studies — see our Influencer Marketing ROI Complete Guide. And for hands-on creator attribution across your program, book a demo with partnrUP.
Frequently Asked Questions
What are the most important influencer marketing KPIs for beginners?
Start with three core KPIs: engagement rate (quality of audience interaction), conversion rate (are people buying?), and ROIS (is the program generating positive returns?). These three metrics cover awareness quality, commercial effectiveness, and financial efficiency. Add more KPIs as your program and measurement sophistication grow.
How often should I review influencer marketing KPIs?
Review per-post metrics within 48-72 hours of publication (early signals), campaign-level metrics weekly during active campaigns, program-level metrics monthly, and strategic KPIs (LTV, incrementality, sentiment) quarterly. Don’t over-optimize on short-term fluctuations — look for consistent patterns across multiple data points.
Which KPIs matter most for different campaign objectives?
Awareness campaigns: reach, SOV, branded search lift. Engagement campaigns: engagement rate, comment quality, share rate. Conversion campaigns: CTR, conversion rate, revenue per post, CPA. Brand building: sentiment shift, creator retention, LTV of acquired customers. Match your primary KPIs to your campaign objective.
How do I benchmark my KPIs against industry standards?
Use published industry reports (Influencer Marketing Hub, CreatorIQ, Aspire annual reports), platform-specific benchmarks (TikTok, Instagram, and YouTube publish creator performance data), and your own historical data. The most valuable benchmarks are your own — tracking improvement over time is more actionable than comparing to industry averages.
What’s the difference between engagement rate calculated by followers vs. by reach?
Engagement rate by followers (engagements/followers) is easier to calculate but less accurate because not all followers see every post. Engagement rate by reach (engagements/reach) reflects actual audience response and is more meaningful. Use reach-based engagement rates when platform data is available; use follower-based rates for initial creator vetting when reach data isn’t accessible.
Should I track influencer marketing KPIs separately from overall marketing KPIs?
Track them both separately and as part of your overall marketing dashboard. Separate tracking reveals influencer-specific optimization opportunities. Integrated tracking enables accurate channel comparison and budget allocation decisions. The most effective marketing teams maintain both views and use them for different decision types.
How do I get creator buy-in for KPI tracking?
Share performance data transparently with your creators. When creators see their own KPI data — which content performed best, what drove the most conversions, which posting times maximized reach — they become invested in optimization. Provide a creator performance report after every campaign showing their individual metrics against program benchmarks. This creates a feedback loop that improves content quality over time. Creators who understand your KPIs create better content for your brand — which is why platforms like partnrUP include creator-facing dashboards alongside brand analytics tools.