




Most brands measuring the digital shelf are measuring the wrong thing. They track where a product ranks, screenshot it, and paste it into a monthly deck. By the time anyone reads that deck, the ranking has already changed and nobody can say what caused it.
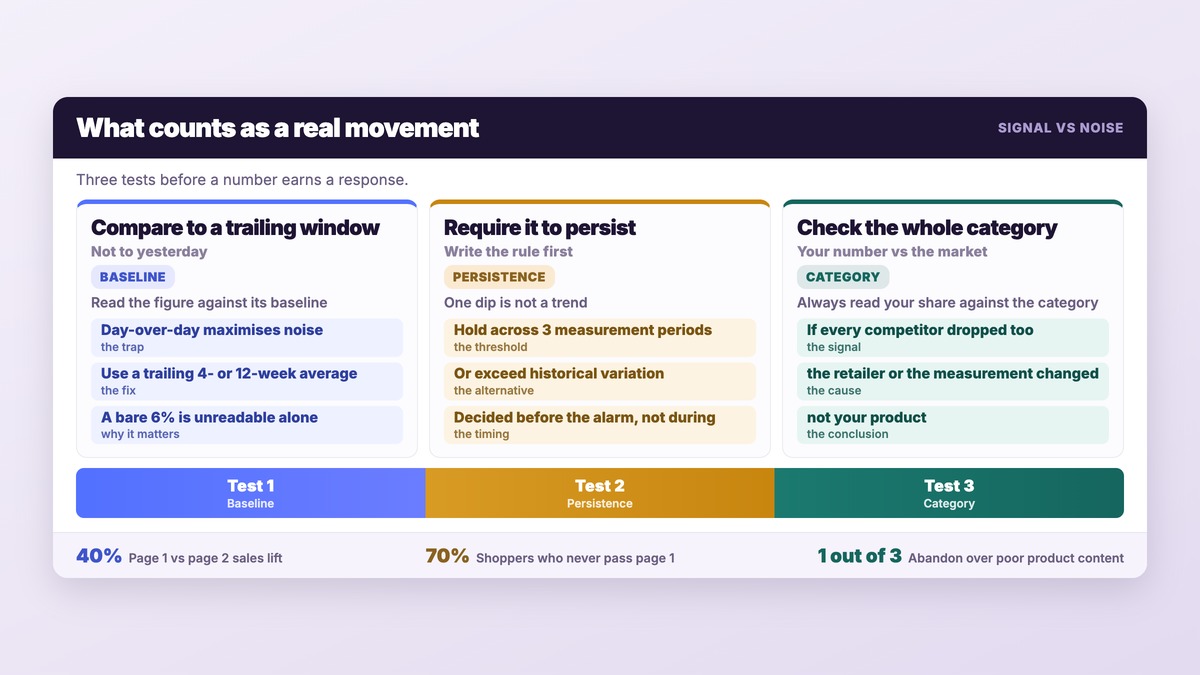
If you are still establishing the basics, our primer on what the digital shelf is and why brands should care covers the ground beneath this one. Digital shelf analytics is the practice of instrumenting product discovery the way you would instrument a paid channel: a defined metric set, a measurement cadence, a baseline to compare against, and an owner for each alert. Profitero, which tracks more than 80 million products daily across 1,400+ retailers, frames the stakes bluntly on its own product page — moving a product from page 2 to page 1 can boost sales by 40%, because more than 70% of online shoppers never click past the first page.
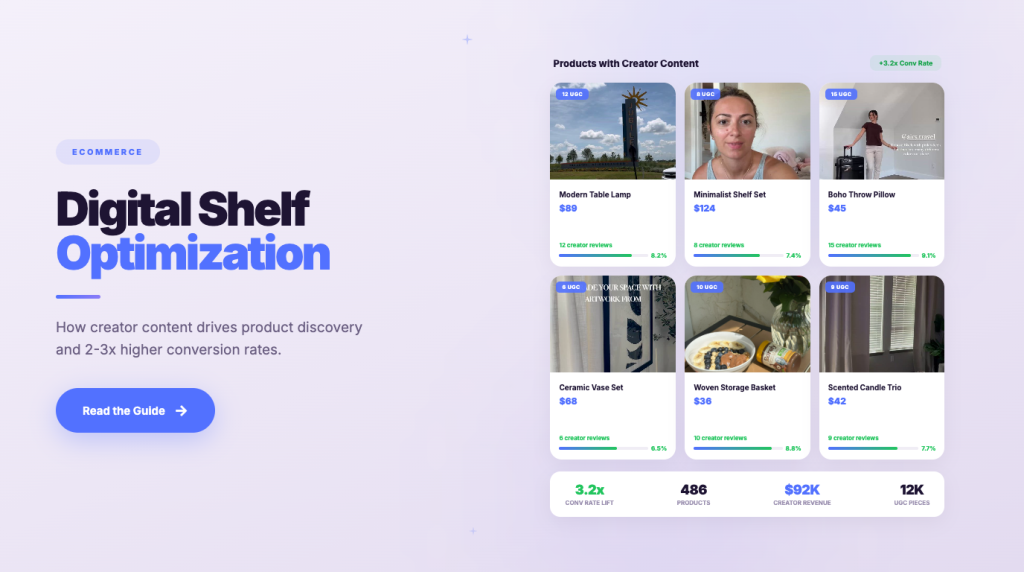
This guide covers the operational layer: what to measure, how often, how to tell a real movement from noise, and where creator content fits as a lever you can actually pull when the numbers move against you. For the strategic foundation — what the digital shelf is and why creator content outperforms brand content on it — start with our digital shelf optimization guide.
Why Most Digital Shelf Reporting Fails
The common failure is not a missing tool. It is a missing decision rule. Teams collect rank data without ever defining what number triggers an action, so the data accumulates and nothing changes.
Three patterns show up repeatedly:
Screenshot Reporting
Someone searches the category term, screenshots page one, and files it. This captures a single moment from a single location on a single device. Retailer search results are personalized and volatile, so one observation tells you almost nothing about your actual position. Worse, it cannot be compared to last month's screenshot in any rigorous way.
Measuring Everything Equally
A dashboard with forty metrics and no hierarchy is a dashboard nobody opens. If content compliance, price monitoring, review velocity, and share of search all carry the same visual weight, the team has no signal about where to spend Tuesday morning.
No Baseline
Without a baseline, every number is unreadable. A 6% share of search means nothing in isolation. Against a trailing 12-week average of 4%, it is a win worth understanding and repeating. Against 11%, it is an incident.
The Metric Set That Actually Matters
Four metric families cover most of what a brand needs. Each one answers a different question and triggers a different response.
Share of Search
Share of search measures what fraction of the results for your category's key terms belong to your products. Track it per retailer and per term, not as a blended average — a blended number hides the fact that you are winning on branded terms and losing on the unbranded ones where new customers actually shop.
The distinction matters because branded and unbranded search behave differently. Branded search reflects demand you already created. Unbranded search — "running shoes for flat feet" rather than your brand name — is where discovery happens and where creator content has the most leverage.
Content Health at the SKU Level
Content health means the completeness and accuracy of your product content on each retailer page: title, bullets, images, video, A+ modules, attributes. Profitero reports that 1 out of 3 shoppers abandon their cart due to poor product content.
Measure this per SKU, not per brand. A brand-level content score of 92% is compatible with your three highest-revenue SKUs being broken, because the average is carried by the long tail.
Availability and Out-of-Stock Recovery
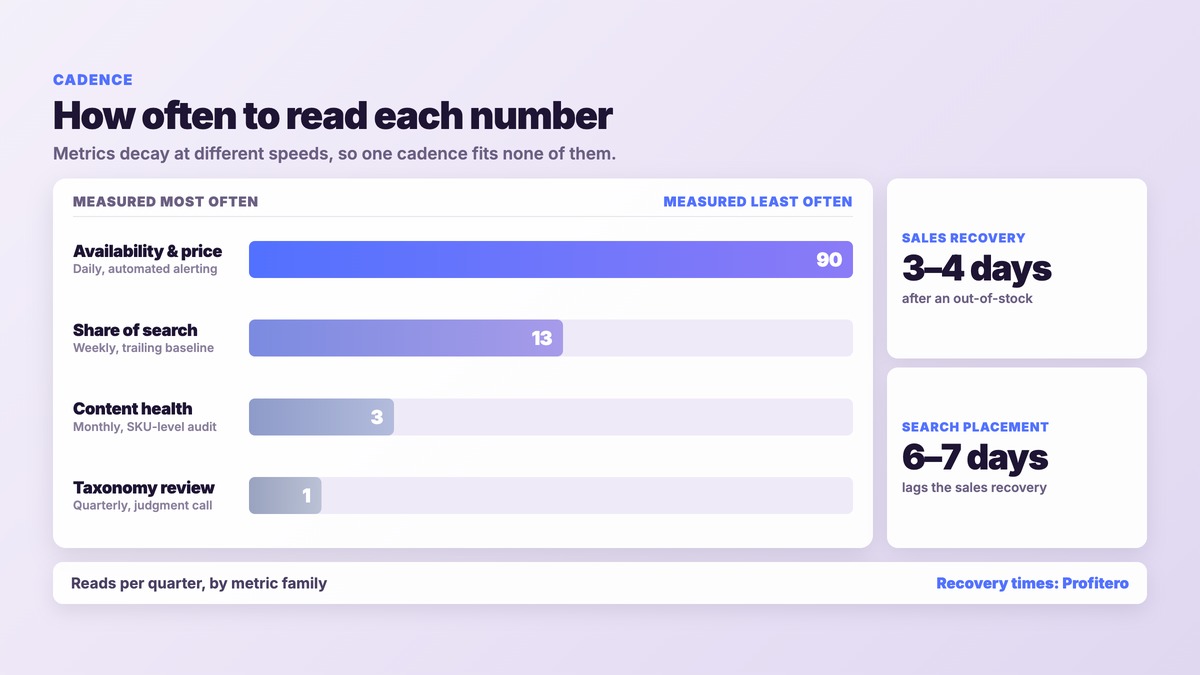
Going out of stock is not a momentary loss. According to Profitero, it takes 3–4 days to recover full sales volume and 6–7 days to regain organic search placement after a product goes out of stock. The search-placement recovery lags the sales recovery, which means an out-of-stock event keeps costing you discovery long after inventory is back.
This is the metric most worth alerting on in real time, because the cost compounds while you are not looking.
Reviews and Ratings Velocity
Rating average is a lagging, slow-moving number. Review velocity — how many new reviews arrive per week — moves faster and predicts where the average is heading. Profitero notes that 7 in 10 shoppers are more influenced by online reviews and content than by in-store displays.
Setting a Measurement Cadence
Different metrics decay at different speeds, so measuring them all monthly is both too slow for some and wasteful for others. A workable default:
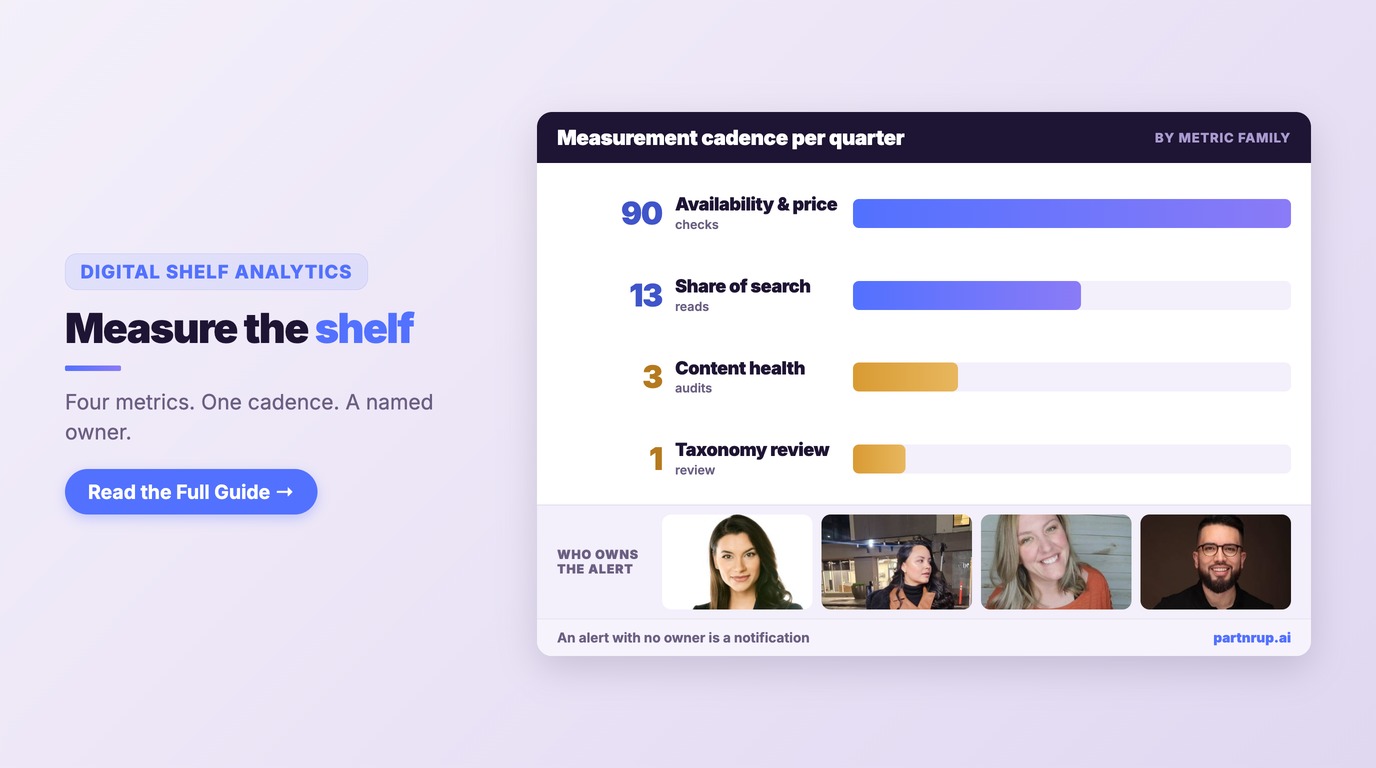
Run as counts over a quarter, that cadence is roughly 90 availability checks, 13 share-of-search reads, 3 content audits, and 1 taxonomy review — a workload that is mostly automated at the top and mostly judgment at the bottom.
Daily: Availability and Price
These change without warning and cost money immediately. They need automated alerting, not a human checking a dashboard.
Weekly: Share of Search and Review Velocity
Weekly is frequent enough to catch a real trend and slow enough that normal volatility averages out. Weekly also matches the rhythm most ecommerce teams already run.
Monthly: Content Health and Competitive Benchmarks
Content changes when you change it, so daily measurement adds noise without insight. Monthly is the right cadence for a full audit and for comparing yourself against category competitors.
Quarterly: Taxonomy and Metric Review
Once a quarter, check that the terms you track are still the terms shoppers use. Search language drifts, categories get renamed, and a tracking list built eighteen months ago quietly stops describing your market.
Telling Signal From Noise
The hardest operational problem in digital shelf analytics is deciding when a movement is real. Retailer search results fluctuate constantly, so a team that reacts to every dip burns itself out chasing nothing.
Compare Against a Trailing Window, Not Yesterday
Day-over-day comparison maximizes noise. A trailing 4-week or 12-week window gives you a stable reference point and makes genuine movement visible.
Require Persistence Before Acting
The same discipline that governs tracking creator affiliate links applies here. Set a rule such as: a share-of-search change counts as real only if it holds for three consecutive measurement periods, or exceeds the normal range of variation you have observed historically. Write the rule down before you need it, so it is not negotiated in the moment by whoever is most alarmed.
Check Whether the Whole Category Moved
If your share dropped and every competitor's share dropped, something changed about the retailer's algorithm or the measurement itself — not about your product. Always read your own number against the category.
Name an Owner Per Alert
An alert with no owner is a notification. An alert routed to a named person with a defined first action is a process. This is the single cheapest improvement most teams can make, and it requires no new software.
Where Creator Content Fits
Analytics tells you a product is losing discovery. It does not fix it. Creator content is one of the more direct levers available, for a specific structural reason: it produces content that lives both on social platforms where discovery now happens and on your retailer product pages where conversion happens.
Unbranded Search Gaps
When share of search is weak on unbranded category terms, the gap is usually a content gap — shoppers are searching in language your product pages do not use. Creator content tends to use the language shoppers actually use, because creators describe products the way their audience talks about them.
Content Health Gaps
When SKU-level content health is weak, the shortfall is often video and lifestyle imagery rather than text. These are the assets a creator program already produces. partnrUP's platform includes Retail Page Syndication, described on its own product page as pushing high-performing content directly to product pages, alongside content management and performance analytics — which closes the loop between the content a creator makes and the page where the metric is measured.
Review Velocity Gaps
When review velocity stalls, seeding products to creators is a well-established response, and a structured creator affiliate program keeps it running past the first wave. Pair this with our guide on building a scalable creator content strategy so the response is programmatic rather than a one-off scramble.
For measuring whether that creator investment paid back, see our influencer marketing attribution guide and the companion piece on setting budgets from expected ROI.
Building the Reporting Layer
A digital shelf report should fit on one screen and answer one question: what needs attention this week?
Lead With Exceptions
Show what moved outside its normal range, not the full metric table. The full table belongs one click deeper for anyone who wants it.
Carry the Baseline Beside Every Number
Never show a bare figure. Show the figure, the trailing average, and the direction. A reader should not have to remember last month's number to interpret this month's.
Separate Diagnosis From Action
Each exception needs a stated hypothesis and a next step with an owner. "Share of search down 3 points on unbranded terms" is an observation. "Share down 3 points on unbranded terms; content gap on video; creator brief going out Thursday, owned by Maya" is a report.
Common Pitfalls
Tracking Terms You Want Instead of Terms Shoppers Use
Brands consistently track the category language used in their internal planning rather than the language in the search bar. Build the tracking list from actual retailer search data and refresh it quarterly.
Treating Every Retailer the Same
Amazon, Walmart, and a DTC marketplace each rank products differently and expose different content fields. A single blended score across retailers averages away the specific, fixable problem on each one.
Measuring Without a Content Response Ready
If your analytics identify a content gap and it takes six weeks to produce an asset, the analytics cadence is faster than your ability to act on it. Match your content supply to your measurement cadence, or slow the cadence down.
Frequently Asked Questions
What is digital shelf analytics?
It is the practice of systematically measuring how your products are found, presented, and reviewed on retailer sites and search surfaces — share of search, content health, availability, pricing, and reviews — on a defined cadence with defined action thresholds.
How is it different from ecommerce reporting?
Ecommerce reporting measures outcomes: sales, conversion, traffic. Digital shelf analytics measures the upstream conditions that produce those outcomes. It tells you why a sales number moved, which outcome reporting cannot.
How often should we measure?
Availability and price daily with automated alerting; share of search and review velocity weekly; content health and competitive benchmarks monthly; the tracking taxonomy itself quarterly.
What is share of search?
The fraction of search results for a given term that belong to your products. Track it per term and per retailer, and keep branded and unbranded terms separate — they answer different questions.
How do we know a change is real and not noise?
Compare against a trailing window rather than the prior day, require the change to persist across multiple periods or exceed historical variation, and check whether the entire category moved at the same time.
Where does creator content fit?
It is the response mechanism. Analytics identifies gaps in unbranded discovery, content completeness, or review velocity; creator content is a direct way to fill all three, and the resulting assets can be syndicated to the product pages where the metrics are measured.
Do we need a dedicated platform to start?
No. A defined metric set, a weekly cadence, a trailing baseline, and a named owner per alert will outperform an expensive tool used without those four things. Add tooling when manual collection becomes the bottleneck.
Start With Four Numbers
Pick four metrics, one per family. Establish a trailing baseline. Set a persistence rule so you know what counts as real. Name an owner for each. That system, run weekly, beats a forty-metric dashboard nobody opens.
When the numbers show a discovery gap, you need creator content in market fast enough to matter. See how partnrUP handles creator matching, content management, and performance analytics in one workflow.