Nearly 88% of marketers plan to increase their influencer marketing budgets in 2026, according to Influencer Marketing Hub’s 2026 Benchmark Report — yet most still can’t answer a simple question: what’s the actual return? The gap between spending and measuring isn’t a data problem. It’s a formula problem. Without a repeatable, step-by-step calculation framework, every campaign lives in a fog of vanity metrics and gut feelings.
This guide is part of our Influencer Marketing ROI: The Complete Guide to Measuring, Tracking & Proving Results — the definitive resource for understanding how to measure, track, and prove the value of every creator partnership.
In this guide, you’ll learn:
- The exact formula for calculating influencer marketing ROI — and how to adapt it for different campaign goals
- How to identify and assign dollar values to every meaningful cost and return
- Step-by-step instructions for building ROI calculations across awareness, engagement, and revenue campaigns
- Which attribution methods actually work for tracking creator-driven conversions in 2026
- How to build a living ROI dashboard that improves with every campaign cycle
Table of Contents
- The Influencer Marketing ROI Formula
- Step 1: Define Campaign Objectives and KPIs
- Step 2: Calculate Total Investment
- Step 3: Track and Quantify Measurable Returns
- Step 4: Apply the Right Attribution Model
- Step 5: Run the Calculation and Benchmark
- Step 6: Build a Living ROI Dashboard
- Common Calculation Mistakes That Inflate or Deflate ROI
- Conclusion
- Frequently Asked Questions
The Influencer Marketing ROI Formula
Before diving into the step-by-step process, you need to understand the core formula that underpins every ROI calculation in influencer marketing:
Influencer Marketing ROI = [(Value of Returns – Total Investment) / Total Investment] × 100
That’s the skeleton. The challenge — and where most brands fail — is accurately defining what counts as “returns” and what counts as “investment.” A brand running an awareness campaign measures returns differently than one tracking direct e-commerce conversions. A team using affiliate links and UTM tracking will capture revenue data that a brand relying on promo codes alone will miss.
Why a Single Number Isn’t Enough
The formula gives you a percentage. But a 300% ROI on a $5,000 micro-influencer campaign tells a fundamentally different story than a 300% ROI on a $500,000 enterprise program. Context matters as much as the calculation. That’s why this guide walks through not just the math, but the thinking behind each input — so your final number actually means something to your CFO, your CMO, and your next budget request.
The IMH 2026 Benchmark Report found that 65.9% of marketers expect ROI payback within one month, with 48.4% expecting it within two weeks. Those timelines only work if your formula is set up before the campaign launches — not cobbled together after the content goes live.
Step 1: Define Campaign Objectives and KPIs
Every ROI calculation starts with a question: what does success look like? Without clear objectives, you’ll measure the wrong things and draw the wrong conclusions.
Map Objectives to Measurable KPIs
The three most common influencer campaign objectives each require different KPIs:
- Brand Awareness: Impressions, reach, video views, brand mention volume, share of voice. Assign a CPM-based value (e.g., if your paid media CPM is $12, 1 million organic impressions = $12,000 in equivalent media value).
- Engagement and Consideration: Likes, comments, saves, shares, click-through rate, email signups. Assign a CPC-based value using your paid social benchmarks.
- Direct Revenue: Conversions, order value, revenue attributed via affiliate links, promo codes, or UTM-tracked landing pages. This is the most straightforward — dollars in, dollars out.
According to the IMH 2026 Benchmark Report, brand awareness is the most selected KPI at 55.1%, while revenue and sales KPIs are selected less frequently. This means most brands are running awareness campaigns but trying to measure them with revenue formulas — a mismatch that produces misleading ROI numbers.
Set Your Baseline Before Launch
Document your current metrics before any creator content goes live. You can’t measure lift without a baseline. Record your organic social engagement rate, website traffic from social channels, conversion rate on key landing pages, and current brand search volume. Platforms like partnrUP centralize campaign tracking and baseline metrics in one dashboard, eliminating the manual spreadsheet work that causes most measurement gaps.
Step 2: Calculate Total Investment
Most brands undercount their investment by 30-40% because they only include creator fees. True investment includes every dollar and hour that goes into making the campaign happen.
Direct Costs
- Creator compensation: Flat fees, performance bonuses, gifted product value, commission payouts
- Content production: Shipping products, studio time, professional editing, music licensing
- Platform and tool fees: Influencer marketing platform subscriptions, analytics tools, affiliate tracking software
- Paid amplification: Whitelisting spend, boosted creator posts, paid media using creator content
Indirect Costs
- Team labor: Hours spent on creator outreach, negotiation, briefing, review cycles, and reporting — multiplied by fully loaded hourly rate
- Agency fees: Retainers, percentage-of-spend models, project fees
- Opportunity cost: What else could your team have been doing? This is harder to quantify but matters for programs running entirely in-house
The IMH 2026 Benchmark Report found that 66.3% of brands run influencer programs entirely in-house. For these teams, labor costs are often the largest hidden expense. A brand manager spending 20 hours per week on influencer operations at a $75/hour fully loaded rate adds $6,000/month to the true investment — whether or not it appears on a line item.
Build a Cost Template
Create a standardized cost template that you fill out for every campaign. Include line items for each category above. The goal is consistency — you can’t compare ROI across campaigns if Campaign A includes labor costs and Campaign B doesn’t. Teams using partnrUP’s campaign management tools automatically track creator payments, content production costs, and platform fees in a single view, making the investment calculation a data pull instead of a spreadsheet exercise.
Step 3: Track and Quantify Measurable Returns
This is where most ROI calculations break down. Tracking returns requires both the right tools and the right valuation framework.
Direct Revenue Returns
The most concrete returns come from trackable conversions:
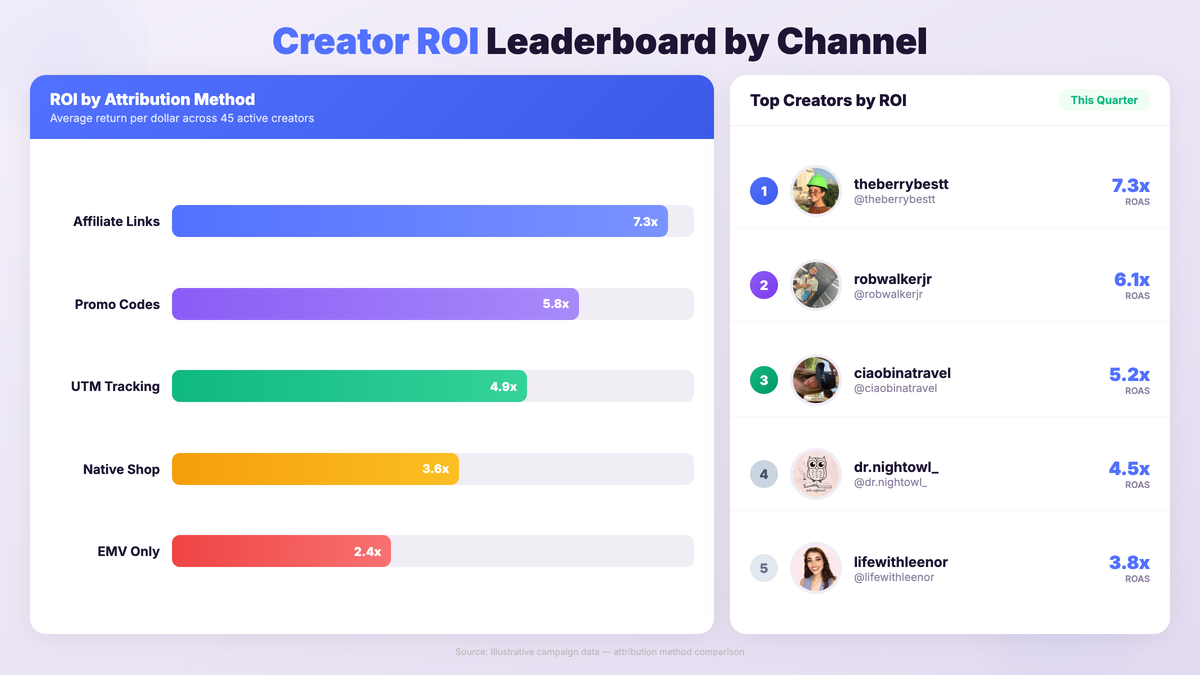
- Affiliate link revenue: Revenue generated through creator-specific affiliate links. According to the IMH 2026 Benchmark Report, 26% of brands use affiliate links for attribution measurement.
- Promo code revenue: Sales driven by creator-specific discount codes. 45.9% of brands use promo or discount codes — the most popular attribution method (IMH 2026).
- UTM-tracked conversions: Website traffic and conversions from UTM-tagged creator links, tracked through Google Analytics or your analytics platform.
- Native shop features: Revenue from TikTok Shop, Instagram Shopping, or other native social commerce tools. 25% of brands use native shop features for attribution (IMH 2026).
Indirect Value Returns
Not every return shows up in your payment processor. These indirect returns require value assignment:
- Earned media value (EMV): Calculate the cost to achieve the same reach and engagement through paid media. If a creator post generates 500,000 impressions and your paid CPM is $15, that’s $7,500 in earned media value.
- Content assets: Creator content that your brand repurposes for ads, email, website, and other channels. Assign a value based on what equivalent studio-produced content would cost. A single high-quality creator video might replace a $3,000-$5,000 studio shoot. Learn more in our guide on getting maximum value from creator assets.
- Brand lift: Increases in brand search volume, direct traffic, social following growth, and sentiment shift. These require pre/post measurement to quantify.
- Customer lifetime value (CLV) impact: Customers acquired through creator recommendations often have higher retention rates and lifetime value than those from paid ads. If your average CLV is $200 and creator-acquired customers retain 20% longer, each creator-driven acquisition carries a $40 premium.
The Valuation Framework
Every return needs a dollar value. Use these benchmarks to assign consistent values across campaigns:
- Impressions: Your average paid CPM (typically $8-$25 depending on platform and audience)
- Engagements: Your average cost per engagement from paid social ($0.10-$1.50)
- Clicks: Your average CPC from paid campaigns ($0.50-$3.00)
- Email signups: Your average cost per lead from other channels ($5-$50)
- Content pieces: Equivalent production cost ($500-$5,000 per asset depending on quality)
Step 4: Apply the Right Attribution Model
Attribution determines how much credit the influencer campaign gets for each conversion. Choose the wrong model and your ROI will be either inflated or artificially depressed.
Common Attribution Models for Influencer Marketing
- Last-touch attribution: The influencer gets 100% credit if their link or code was the final touchpoint before purchase. Simple but ignores the awareness journey. Best for direct-response campaigns with short conversion windows.
- First-touch attribution: The influencer gets 100% credit for introducing the customer. Better for awareness campaigns but ignores what actually closed the sale.
- Multi-touch attribution: Credit is distributed across all touchpoints in the customer journey. More accurate but requires sophisticated tracking infrastructure. This is the gold standard for mature programs.
- Time-decay attribution: Touchpoints closer to the conversion get more credit. Works well for longer sales cycles where influencer content plants the seed but retargeting ads close the deal.
- Incrementality testing: Compare conversion rates between audiences exposed to influencer content and a holdout group that wasn’t. This isolates the true incremental lift from creator partnerships.
Matching Models to Campaign Types
For a deeper dive on matching attribution models to your specific campaign structure, see our complete attribution guide. The short version: use last-touch for performance campaigns, multi-touch for integrated programs, and incrementality testing when you need to prove lift to skeptical stakeholders.
One critical consideration: attribution windows matter enormously. A 7-day window will capture impulse purchases but miss considered buys. A 30-day window captures more but risks attributing conversions that would have happened anyway. Most influencer marketing teams find that a 14-day attribution window balances accuracy and credit fairly for mid-funnel campaigns.
Step 5: Run the Calculation and Benchmark
With your costs cataloged, returns valued, and attribution model applied, it’s time to run the actual math.
The Step-by-Step Calculation
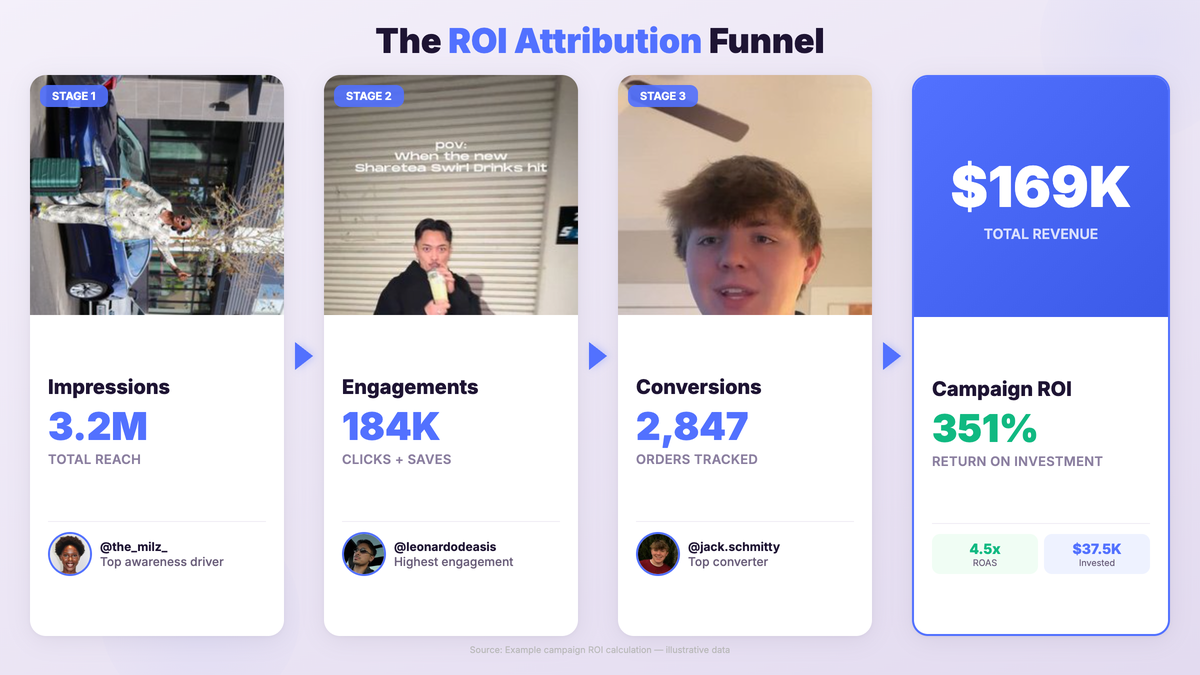
Here’s a worked example for a mid-market brand running a 10-creator campaign:
Total Investment:
- Creator fees: $25,000 (10 creators × $2,500 average)
- Product gifting: $2,000
- Platform subscription: $1,500/month (prorated to campaign)
- Team labor: $4,000 (80 hours × $50/hour)
- Paid amplification: $5,000
- Total: $37,500
Measurable Returns:
- Direct affiliate/promo code revenue: $85,000
- Earned media value (3.2M impressions × $14 CPM): $44,800
- Content repurposing value (40 assets × $750 equivalent): $30,000
- Email signups (1,200 × $8 CPL equivalent): $9,600
- Total: $169,400
ROI Calculation:
[($169,400 – $37,500) / $37,500] × 100 = 351.7% ROI
For every dollar invested, this campaign returned $4.52 in measured value. But the number alone isn’t enough — you need benchmarks.
Industry Benchmarks to Compare Against
Industry averages vary by vertical, creator tier, and campaign type. The widely cited benchmark is $5.20 earned media value per $1 spent, though this varies significantly:
- Nano-influencers (1K-10K followers): Often deliver the highest engagement ROI — sometimes 8-10x — but lower total volume
- Mid-tier creators (50K-500K): Typically deliver 4-6x ROI with a balance of reach and authenticity
- Macro/celebrity creators (500K+): Lower ROI ratios (2-4x) but massive absolute reach, suited for awareness objectives
The IMH 2026 Benchmark Report found that 72.2% of marketers expect budget increases of 50% or more, signaling that the industry’s confidence in influencer ROI continues to accelerate — especially as AI-powered measurement tools close the attribution gap. For brands looking to understand the full landscape of ROI measurement options, our platform comparison guide breaks down how different tools handle attribution and reporting.
Step 6: Build a Living ROI Dashboard
A one-time ROI calculation tells you what happened. A living dashboard tells you what’s happening — and helps you optimize in real time.
Essential Dashboard Components
- Campaign-level ROI: Individual campaign ROI calculated using the formula above, updated as new conversion data flows in
- Creator-level ROI: ROI broken down by individual creator — essential for identifying your highest-performing partners for long-term partnerships
- Channel-level ROI: ROI segmented by platform (TikTok, Instagram, YouTube) to optimize budget allocation
- Rolling ROI trend: Month-over-month ROI trajectory showing whether your program is improving, plateauing, or declining
- Cost efficiency metrics: CPM, CPC, CPA, and cost per engagement alongside ROI to identify efficiency drivers
Automate Data Collection
Manual data collection is the number one reason ROI dashboards fail. If your team has to pull numbers from five different platforms, export CSVs, and update formulas weekly, the dashboard will be outdated within a month. Use platform integrations that automatically sync creator performance data, conversion tracking, and cost data into a single view. partnrUP’s reporting dashboard consolidates creator performance, revenue attribution, and cost tracking automatically — so your ROI numbers update in real time without manual exports.
Use ROI Data to Optimize Future Campaigns
The real power of a living dashboard is optimization. After each campaign cycle:
- Double down on top performers: Creators with 5x+ ROI get priority for future campaigns and larger budgets
- Cut underperformers early: If a creator’s ROI is below 1x after a full campaign cycle, reallocate that budget
- Optimize content formats: Track which content types (Reels, long-form YouTube, TikTok, Stories) drive the highest ROI per dollar and shift creative briefs accordingly. For guidance on briefing creators effectively, see our creative brief guide.
- Adjust attribution windows: If your data shows most conversions happening within 3 days, tighten your window. If conversions trickle in over 3 weeks, extend it.
- Benchmark quarter over quarter: Compare Q2 ROI against Q1. Are you getting more efficient? If not, diagnose whether it’s a cost issue (rising creator fees) or a returns issue (declining conversion rates).
Common Calculation Mistakes That Inflate or Deflate ROI
Even with the right formula, these errors can make your ROI number meaningless:
Mistakes That Inflate ROI
- Counting impressions as unique reach: If one person sees a creator’s post three times, that’s 3 impressions but 1 reach. Using impressions in your EMV calculation without adjusting for frequency inflates the number.
- Ignoring content cannibalization: If a creator’s audience heavily overlaps with your existing customers, some of those “attributed” sales would have happened anyway. Incrementality testing catches this.
- Using vanity EMV multipliers: Some EMV calculators use inflated CPM benchmarks ($30-50) that don’t reflect what you’d actually pay for that media. Use your paid media CPMs, not industry-reported averages.
- Forgetting organic baseline: If your website already converts at 2% and the creator-driven landing page converts at 2.5%, the influencer’s incremental lift is 0.5% — not 2.5%.
Mistakes That Deflate ROI
- Only counting direct sales: Ignoring EMV, content value, and brand lift dramatically understates the total return. A campaign might look like a loss on direct revenue alone but deliver 5x when you include earned media and content repurposing value.
- Using too-short attribution windows: A 24-hour window misses the majority of considered purchases. If your product has a 2-week average consideration period, a 1-day window will miss 80%+ of influenced purchases.
- Excluding long-tail content value: A YouTube video or blog post continues generating views and conversions for months or years. If you measure ROI only during the campaign period, you’ll miss the compounding long-tail return.
- Not accounting for CLV: Each new customer acquired through a creator has a lifetime value, not just a first-purchase value. Failing to include CLV understates the true return by the difference between first-order revenue and total customer value.
For a comprehensive look at how AI is helping brands scale programs without adding headcount — and how automated tracking eliminates many of these calculation errors — explore how modern platforms handle the operational complexity that makes manual ROI tracking so error-prone.
Conclusion
Calculating influencer marketing ROI isn’t complicated — it’s systematic. Define your objectives, catalog every cost, value every return, choose the right attribution model, run the formula, and build a dashboard that evolves with your program. The brands that consistently prove ROI aren’t doing more complex math. They’re doing the same math more consistently, with better data inputs and clearer frameworks.
The step-by-step formula in this guide gives you a repeatable framework you can apply to every campaign, every quarter, every budget review. Start with the basics — direct costs and trackable revenue — and layer in EMV, content value, and CLV as your measurement infrastructure matures.
Ready to automate the tracking side of this equation? Explore partnrUP’s measurement and attribution tools to see how AI-powered tracking consolidates every ROI input into a single dashboard. Or book a demo to see the formula in action with your own campaign data.
Frequently Asked Questions
What is a good ROI for influencer marketing?
A commonly cited industry benchmark is $5.20 in earned media value per $1 spent. However, “good” depends heavily on your campaign objectives. A brand awareness campaign might target 3-4x EMV return, while a direct-response affiliate campaign should aim for 5-10x on trackable revenue alone. The key is benchmarking against your own historical performance and your paid media alternatives — not industry averages.
How do you calculate influencer marketing ROI?
Use the formula: [(Value of Returns – Total Investment) / Total Investment] × 100. Total Investment includes creator fees, product costs, labor, platform fees, and paid amplification. Value of Returns includes direct revenue (affiliate links, promo codes), earned media value, content repurposing value, and downstream metrics like email signups. Apply the appropriate attribution model and run the calculation at the campaign, creator, and channel level.
What costs should I include in my influencer marketing investment?
Include all direct and indirect costs: creator compensation (flat fees, bonuses, commissions), product gifting and shipping, content production costs, platform subscriptions, paid amplification spend, team labor hours (at fully loaded rates), and agency fees if applicable. Most brands undercount investment by 30-40% by excluding labor and opportunity costs.
Which attribution model should I use for influencer campaigns?
Multi-touch attribution is the gold standard for mature programs because it distributes credit across all touchpoints. For simpler campaigns with clear conversion paths (e.g., promo code + direct purchase), last-touch attribution works well. If you need to prove incrementality to skeptical executives, run controlled incrementality tests that compare exposed vs. holdout audiences.
How long should I track ROI after a campaign ends?
Track for at least 30 days post-campaign for standard social media content. For YouTube videos and blog collaborations, extend tracking to 90 days or longer — these formats generate long-tail views and conversions. Some brands track evergreen creator content for 6-12 months, updating ROI calculations quarterly to capture the compounding return.
How do I calculate earned media value for influencer content?
Multiply the total impressions or reach by your brand’s actual paid media CPM for that platform. For example, if a creator’s Instagram Reel generates 800,000 impressions and your Instagram paid CPM is $12, the EMV is $9,600. Use your paid benchmarks, not inflated industry averages. Some brands also add engagement-based value by multiplying engagements by their cost-per-engagement from paid campaigns.
Can I calculate ROI for brand awareness campaigns?
Yes — use earned media value, brand lift studies, and brand search volume as your return metrics. Compare the cost of achieving the same reach and awareness through paid media (TV, display, paid social) to calculate the efficiency gain. You can also measure pre/post brand awareness through survey tools, track increases in branded search queries, and monitor social share of voice changes during and after the campaign.