Nearly 88% of marketers plan to increase their influencer marketing budgets in 2026, according to the Influencer Marketing Hub Benchmark Report — yet fewer than half can confidently tie creator-driven sales back to the content that generated them. The gap between spending and measurement has never been wider, and brands pouring money into creator commerce without tracking the right metrics are flying blind.
This guide is part of our Creator Commerce: How Brands Win in the New Social Shopping Era — a comprehensive resource covering strategy, platforms, and measurement for creator-led social selling.
The problem isn’t a lack of data. It’s that most ecommerce teams are drowning in vanity metrics while ignoring the signals that actually predict revenue. Impressions feel good. Engagement rates look impressive in slide decks. But neither tells you whether a creator’s content is moving product off the digital shelf.
In this guide, you’ll learn:
- Which creator commerce metrics directly correlate with revenue — and which ones waste your team’s time
- How to build a measurement framework that connects creator content to actual sales
- The attribution models that work for social commerce versus traditional influencer campaigns
- What conversion benchmarks to target across TikTok Shop, Instagram Shopping, and affiliate programs
- How to use platform-level data to optimize creator selection and content strategy in real time
Table of Contents
- The Revenue Metrics That Actually Matter
- Vanity Metrics: What to Stop Tracking
- Attribution Models for Creator Commerce
- Platform-Specific Metrics by Channel
- Building Your Measurement Framework
- Using Metrics to Optimize Creator Selection
- Conclusion
- FAQ
The Revenue Metrics That Actually Matter
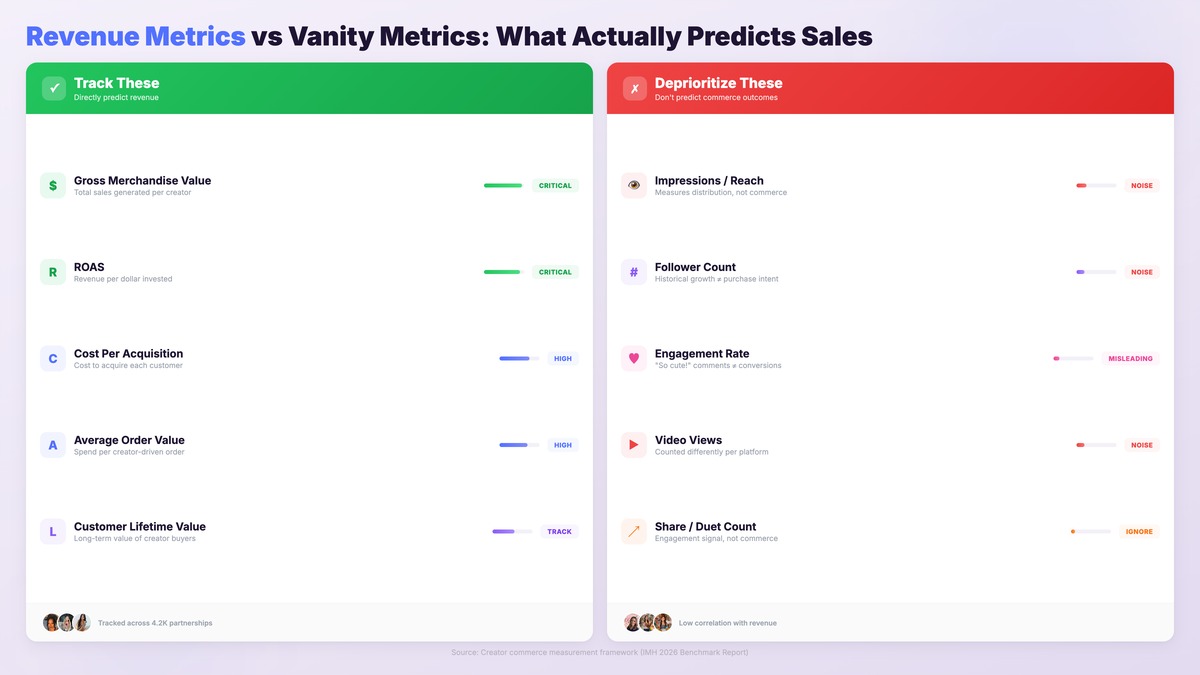
Creator commerce metrics fall into two categories: metrics that predict revenue and metrics that make you feel productive. The distinction matters because 65.9% of marketers now expect payback within one month of a creator campaign launch, according to the IMH 2026 Benchmark Report — with 48.4% expecting results within two weeks. That kind of payback window leaves no room for tracking the wrong signals.
Gross Merchandise Value (GMV)
GMV is the total dollar value of products sold through creator-driven commerce channels. It’s the single most important number in any creator commerce program because it captures the end result: did the creator’s content generate sales?
Track GMV per creator, per content piece, and per campaign. The per-content breakdown matters because a single creator might post ten pieces of content where two drive 80% of the revenue. Without granular GMV tracking, you’ll miss which content formats and creative approaches actually convert.
Return on Ad Spend (ROAS)
Creator ROAS measures the revenue generated for every dollar invested in creator partnerships — including fees, product costs, and any paid amplification. A creator who costs $5,000 and drives $25,000 in attributable sales delivers a 5x ROAS.
The challenge is attribution. Unlike paid media where a click path is relatively clean, creator commerce involves multiple touchpoints: a viewer might see a TikTok, visit your site three days later, and purchase through a different channel entirely. That’s why attribution model selection (covered below) directly impacts your ROAS calculation.
Cost Per Acquisition (CPA)
CPA tells you what you’re paying per new customer acquired through creator content. Divide total creator investment by the number of new customers attributed to that creator’s content. Track CPA separately from returning customer purchases — a creator who drives repeat buyers is valuable, but new customer acquisition is where most brands build their business case for scaling creator commerce.
Average Order Value (AOV)
Creators don’t just drive traffic — they influence what people buy and how much they spend. Track AOV for creator-driven orders against your site-wide average. High-performing creators often drive AOV 15-30% above baseline because their content provides social proof and product education that reduces purchase hesitation on higher-priced items.
Customer Lifetime Value (CLV) from Creator Channels
This is the metric most brands ignore — and it’s the one that justifies long-term creator partnerships over one-off campaigns. Customers acquired through creator content often have different retention patterns than those from paid ads. Track 90-day and 180-day repurchase rates for creator-acquired customers versus other channels to understand the true value of creator commerce.
Vanity Metrics: What to Stop Tracking
Not every metric is worth your team’s time. Some numbers look impressive in reports but have no predictive relationship with revenue. Here’s what to deprioritize — or stop tracking entirely.
Impressions and Reach
Impressions tell you how many times content was displayed, not whether anyone noticed, cared, or took action. A creator with 2 million impressions and zero sales is less valuable than a nano-creator with 15,000 impressions and 50 conversions. Impressions measure distribution. They don’t measure commerce.
The exception: if you’re running a top-of-funnel awareness campaign with no commerce objective, impressions are relevant. But for creator commerce programs, they’re a distraction.
Follower Count
The influencer marketing industry spent years obsessing over follower count, and brands are still paying for it. Follower count tells you about a creator’s historical audience growth — not their current engagement quality, audience purchasing power, or ability to drive sales. AI-powered creator matching platforms now analyze dozens of signals beyond follower count to predict commerce performance.
Engagement Rate (As a Standalone Metric)
Engagement rate is the most dangerous vanity metric because it feels actionable. A 6% engagement rate sounds great until you realize those engagements are comments like “so cute!” that never convert to purchases. Engagement rate matters only when correlated with downstream conversion data. Track engagement-to-conversion ratio instead: of the people who engaged with a creator’s content, what percentage went on to purchase?
Video Views
Platforms count views differently — TikTok counts at 1 second, YouTube at 30 seconds, Instagram varies by format. Comparing view counts across platforms is meaningless. More importantly, views without commerce intent are irrelevant for creator commerce programs. Track view-to-click rate and click-to-purchase rate instead.
Attribution Models for Creator Commerce
Attribution is where creator commerce measurement gets complicated — and where most brands get it wrong. The model you choose determines which creators get credit for sales, which directly affects how you allocate budget. Currently, 45.9% of brands use promo or discount codes as their primary attribution method, followed by affiliate links (26%) and native shop features (25%), according to the IMH 2026 Benchmark Report.
Last-Click Attribution
Last-click gives 100% credit to the final touchpoint before purchase. It’s simple to implement but systematically undervalues creators who drive awareness and consideration. A creator whose content introduces a product gets zero credit if the customer later clicks a retargeting ad to purchase. Avoid last-click for creator commerce unless you have no other option.
First-Touch Attribution
First-touch gives 100% credit to the creator who first introduced the customer to your brand. It over-credits discovery and ignores the conversion path, but it’s useful for understanding which creators are best at bringing new audiences into your funnel.
Multi-Touch Attribution (MTA)
MTA distributes credit across every touchpoint in the customer journey. It’s the most accurate model but requires sophisticated tracking infrastructure — pixel-based tracking, cookie consent compliance, and a data platform that can stitch together cross-channel journeys. For brands running creator commerce at scale, MTA is the gold standard. Understanding which attribution model fits your program is critical before investing in measurement infrastructure.
Promo Code Attribution
Unique promo codes remain the most widely used attribution method in creator commerce because they’re simple and platform-agnostic. Each creator gets a unique code; every redemption is attributed to that creator. The limitation: promo codes only capture bottom-funnel activity. A customer might discover your product through a creator’s content, research independently, and purchase without using the code.
UTM and Affiliate Link Tracking
UTM parameters and affiliate links capture click-level data and provide a cleaner attribution path than promo codes. They enable per-content tracking — you can see which specific post, video, or story drove each sale, not just which creator. For brands managing multiple creator affiliate tracking methods, combining UTM data with native platform analytics provides the most complete picture.
Platform-Specific Metrics by Channel
Each social commerce platform offers different native analytics. Knowing which platform-specific metrics matter — and which are noise — prevents your team from reporting on data that doesn’t drive decisions.
TikTok Shop
TikTok is the dominant platform for creator commerce investment, with 31% of marketers including TikTok in their influencer plans — the highest selection rate of any platform according to the IMH 2026 Benchmark. TikTok Shop surfaces metrics that matter for commerce:
- GMV per video: The dollar amount generated by each piece of shoppable content
- Add-to-cart rate: Percentage of viewers who add a product to their cart from the video
- Checkout completion rate: Of those who add to cart, how many complete the purchase
- Sample request conversion: For product seeding campaigns, the rate at which sample recipients create content and drive sales
Ignore TikTok vanity metrics: video shares and duets are engagement signals, not commerce signals. Focus on the shopping-specific analytics within TikTok Seller Center.
Instagram Shopping
Instagram’s commerce metrics are split across Shops, product tags, and affiliate links:
- Product page views from creator content: How often creator tags drive users to your product pages
- Save rate on shoppable posts: Saves correlate with future purchase intent more strongly than likes
- Story swipe-up/link-click rate: The conversion entry point for most Instagram commerce
- Checkout-from-tag rate: For Instagram Checkout, the percentage who purchase directly from a product tag
Affiliate Programs
For brands running creator affiliate programs through platforms like partnrUP, the critical metrics differ from social platform native analytics:
- Earnings per click (EPC): Revenue generated per click on an affiliate link — the universal benchmark for affiliate performance
- Conversion rate by creator tier: How nano, mid-tier, and macro creators convert differently through affiliate links
- Commission-to-revenue ratio: What you’re paying creators as a percentage of the revenue they generate
- Cookie window utilization: What percentage of conversions happen on day 1 versus the full cookie window — this tells you whether creator content drives impulse or considered purchases
Building Your Measurement Framework
A measurement framework isn’t a dashboard. It’s a decision-making system that tells your team what to measure, why it matters, and what action to take when metrics move in either direction. Here’s how to build one for creator commerce.
Step 1: Define Your Commerce Objective
Every creator commerce program optimizes for one of three primary objectives: customer acquisition (new buyers), revenue growth (total sales volume), or margin improvement (lowering blended acquisition costs). Your primary objective determines which metrics sit at the top of your framework.
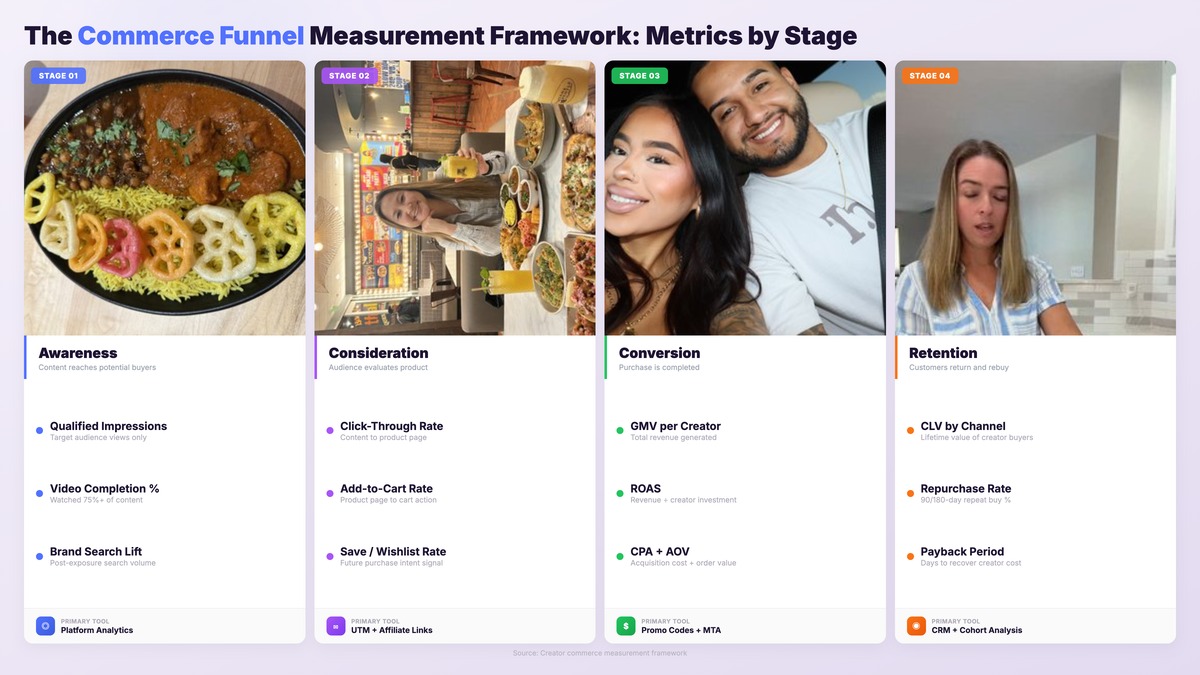
Step 2: Map Metrics to the Commerce Funnel
Organize your metrics into three tiers aligned with the commerce journey:
- Top-funnel (awareness): Qualified impressions, video completion rate, brand search lift
- Mid-funnel (consideration): Click-through rate, product page visits, add-to-cart rate, save rate
- Bottom-funnel (conversion): GMV, ROAS, CPA, AOV, conversion rate
Important: Track at least one metric from each tier. Brands that only track bottom-funnel metrics miss the leading indicators that predict future performance. A drop in mid-funnel click-through rates today means a revenue decline next month — but only if you’re watching.
Step 3: Establish Benchmarks by Creator Tier
Don’t hold a nano-creator (under 10K followers) to the same GMV targets as a macro-creator (500K+). Set tier-specific benchmarks for conversion rate, CPA, and ROAS. Nano and micro-creators typically deliver higher conversion rates and lower CPA but lower absolute GMV. Macro-creators deliver volume but at a higher cost per acquisition. Build your creator affiliate program structure around these tier-level economics.
Step 4: Set Reporting Cadence
Daily: GMV, ROAS, conversion rate (automated dashboard). Weekly: Creator-level performance review, content format analysis. Monthly: CLV analysis, tier-level benchmarking, attribution model review. Quarterly: Full program audit, creator roster optimization, budget reallocation.
Step 5: Build Feedback Loops
Metrics without action are just numbers. Every metric in your framework should have a defined trigger and response. Example: if a creator’s ROAS drops below 2x for two consecutive campaigns, trigger a creative brief review. If a content format’s conversion rate outperforms others by 30%+, scale that format across more creators. Platforms like partnrUP automate these feedback loops with AI-powered performance tracking that flags anomalies and recommends optimization actions.
Using Metrics to Optimize Creator Selection
The real value of tracking creator commerce metrics isn’t reporting — it’s using data to make smarter decisions about which creators to work with, how much to pay them, and what content to request.
Performance-Based Creator Scoring
Build a composite score that weights the metrics most relevant to your commerce objectives. A brand focused on customer acquisition might weight the score: 40% conversion rate + 30% CPA + 20% new customer percentage + 10% content quality. A brand focused on revenue growth might weight: 40% GMV + 30% ROAS + 20% AOV + 10% volume consistency.
This scoring replaces the subjective “vibe check” that still dominates creator selection at most brands. When you can rank 50 creators by a composite commerce score, budget allocation becomes a data decision, not a preference decision. AI-powered matching takes this further by analyzing historical commerce performance across thousands of creators to predict which ones will deliver for your specific products.
Content Format Analysis
Track which content formats drive the highest revenue per content piece: product reviews, tutorials, hauls, “get ready with me” videos, unboxing content, or comparison videos. Most brands will find that 1-2 formats dramatically outperform the rest. Double down on what works rather than diversifying for diversity’s sake.
Commission Structure Optimization
Use your CPA and ROAS data to optimize commission structures. If your average CPA through creator commerce is $35 and your target is $45, you have room to increase commissions to attract higher-performing creators. If CPA is trending above target, reduce base fees and shift to performance-based compensation. The data should drive the economics, not the other way around.
Seasonal and Trend Adjustments
Creator commerce metrics aren’t static. Tracking KPIs over time reveals seasonal patterns: conversion rates spike during Q4 holiday shopping, CPA rises during competitive periods, and certain content formats perform differently by season. Build these patterns into your forecasting so you’re not surprised when December ROAS looks different from June.
Conclusion
Creator commerce is no longer an experimental channel. With US creator ad spend forecast to reach $44 billion in 2026 (IAB), the brands that win will be the ones that treat measurement with the same rigor they apply to paid media and direct-response advertising.
The framework is straightforward: track revenue metrics (GMV, ROAS, CPA, AOV, CLV), ignore vanity metrics that don’t predict sales, choose an attribution model that matches your program complexity, and use platform-specific analytics to optimize at the content level.
Most importantly, use your metrics to make decisions — not just to report. Every data point should trigger an action: scale what works, cut what doesn’t, and continuously refine your creator roster based on commerce performance rather than surface-level engagement.
For brands ready to build a data-driven creator commerce program, partnrUP’s AI-powered platform provides automated tracking, real-time attribution, and performance-based creator matching — so your team can focus on strategy while the platform handles the measurement infrastructure. Book a demo to see how partnrUP can transform your creator commerce metrics into actionable intelligence.
Frequently Asked Questions
What is the most important metric for creator commerce?
Gross Merchandise Value (GMV) is the single most important metric because it directly measures the revenue generated through creator-driven sales channels. While supporting metrics like ROAS and CPA provide context, GMV tells you the bottom-line impact of your creator commerce program. Track it per creator, per content piece, and per campaign to understand what’s actually driving revenue.
How do you measure ROI on creator commerce campaigns?
Calculate creator commerce ROI by dividing attributable revenue (GMV) by total investment (creator fees + product costs + paid amplification + platform fees). Use ROAS as the primary efficiency metric. The attribution method matters: promo codes capture direct conversions, while multi-touch attribution provides a more complete picture of creator influence across the purchase journey.
Why are impressions and engagement rate considered vanity metrics?
Impressions and engagement rate measure content distribution and audience interaction, not purchase behavior. A post with millions of impressions and high engagement can generate zero sales if the audience has no purchase intent. For commerce-focused programs, these metrics only matter when correlated with downstream conversion data — otherwise they consume reporting time without informing revenue decisions.
What attribution model works best for creator commerce?
Multi-touch attribution (MTA) is the most accurate model for mature creator commerce programs because it distributes credit across every touchpoint in the customer journey. However, it requires significant tracking infrastructure. For brands starting out, combining unique promo codes with UTM-tagged affiliate links provides a practical middle ground that captures both direct and click-path attribution.
How often should brands review creator commerce metrics?
Monitor GMV, ROAS, and conversion rates daily through automated dashboards. Conduct weekly creator-level performance reviews and content format analysis. Run monthly CLV analysis and tier-level benchmarking. Perform quarterly full program audits including creator roster optimization and budget reallocation. The cadence ensures you catch performance changes early without drowning your team in constant data review.
What’s the difference between creator commerce metrics and traditional influencer marketing KPIs?
Traditional influencer marketing KPIs prioritize brand awareness: reach, impressions, engagement rate, and sentiment. Creator commerce metrics prioritize revenue: GMV, ROAS, CPA, conversion rate, and AOV. The shift reflects the evolution from creators as awareness drivers to creators as sales channels. Brands running creator commerce programs need a fundamentally different measurement stack than those running awareness-focused influencer campaigns.
How can AI improve creator commerce measurement?
AI enhances creator commerce measurement by automating attribution across complex multi-touch journeys, predicting which creators will deliver the highest commerce performance for specific products, and identifying optimization opportunities in real time. According to the IMH 2026 Benchmark Report, AI is most frequently used for creator discovery, but its application in performance prediction and measurement automation is growing rapidly — with fewer than 11% of marketers reporting they don’t use AI at all in their influencer workflows.