Nearly 88% of marketers plan to increase their influencer marketing budgets in 2026, according to the Influencer Marketing Hub 2026 Benchmark Report. The same report found that brand awareness is the single most-selected KPI, chosen by 55.1% of respondents — while revenue and sales KPIs are selected less frequently. Budgets are climbing toward a forecast $44 billion in US creator ad spend, and the metric most teams report against is the one least able to justify the spend.
This guide is part of our Influencer Marketing ROI: The Complete Guide to Measuring, Tracking & Proving Results — the pillar resource covering attribution, benchmarking, and reporting across creator programs.
That mismatch is the real measurement problem. It is not that teams lack data — every platform exports more of it every year. It is that most influencer marketing dashboards are organized by where the number came from instead of what decision it should trigger. A dashboard with forty metrics and no decision rules is a slide deck, not a measurement system.
This guide reorganizes influencer marketing metrics by decision latency: how quickly a number becomes trustworthy, and what you are supposed to do when it moves. Some metrics are reliable in seventy-two hours and should change your media allocation immediately. Others need a full quarter before they mean anything, and reacting to them early actively destroys performance.
In this guide, you’ll learn:
- Why dashboards organized by platform produce reporting instead of decisions
- The three tiers of influencer marketing metrics, sorted by how fast each one stabilizes
- Which in-flight signals justify reallocating budget mid-campaign — and which are noise at that stage
- How to separate a metric that is genuinely weak from one that is simply immature
- The specific metrics worth retiring in 2026, and what to replace each one with
- How to build a metric stack small enough that your team actually maintains it
Table of Contents
- Why Most Influencer Marketing Dashboards Fail
- The Three Tiers of Influencer Marketing Metrics
- Tier 1: In-Flight Metrics
- Tier 2: Campaign Metrics
- Tier 3: Program Metrics
- The Metrics Worth Retiring in 2026
- Building a Metric Stack Your Team Will Actually Use
- Conclusion
- Frequently Asked Questions
Why Most Influencer Marketing Dashboards Fail
Walk into almost any creator program review and you will see the same artifact: a dashboard assembled from whatever each platform happened to export. Instagram contributes reach and saves. TikTok contributes views and completion. The affiliate tool contributes clicks and conversions. Each section is accurate. Together they answer no question anyone actually asked.
The failure is structural, and it has three recognizable symptoms.
Symptom 1: Every metric is reported at the same cadence
Weekly reporting treats a seventy-two-hour signal and a ninety-day signal as if they carry equal weight. They do not. Early engagement velocity on a piece of creator content is meaningful within days. Incrementality is not — a four-week read on incremental lift is mostly sampling noise dressed up as a trend line. Reporting both every Monday trains the team to react to whichever number moved most, regardless of whether that movement meant anything.
Symptom 2: No metric has an owner or a threshold
A metric without a pre-committed threshold cannot fail. If nobody agreed in advance that a cost-per-acquisition above a set number triggers reallocation, then the number is commentary. The Influencer Marketing Hub 2026 Benchmark Report found that 66.3% of brands run their creator programs entirely in-house, which means these thresholds are almost always an internal decision nobody has formally made — not a vendor default.
Symptom 3: The reported KPI does not match the budget rationale
This is the awkward one. If 55.1% of teams report brand awareness as their primary KPI, but the budget was approved on a revenue argument, the dashboard and the business case are measuring different programs. Finance eventually notices. That gap is where creator budgets get cut during planning season, regardless of how strong the engagement numbers looked.
Fixing this does not require more data. It requires sorting the data you already have by how fast it becomes trustworthy. For the underlying calculation mechanics, our step-by-step influencer marketing ROI formula covers the arithmetic; this guide covers which inputs deserve a place in the dashboard at all.
The Three Tiers of Influencer Marketing Metrics
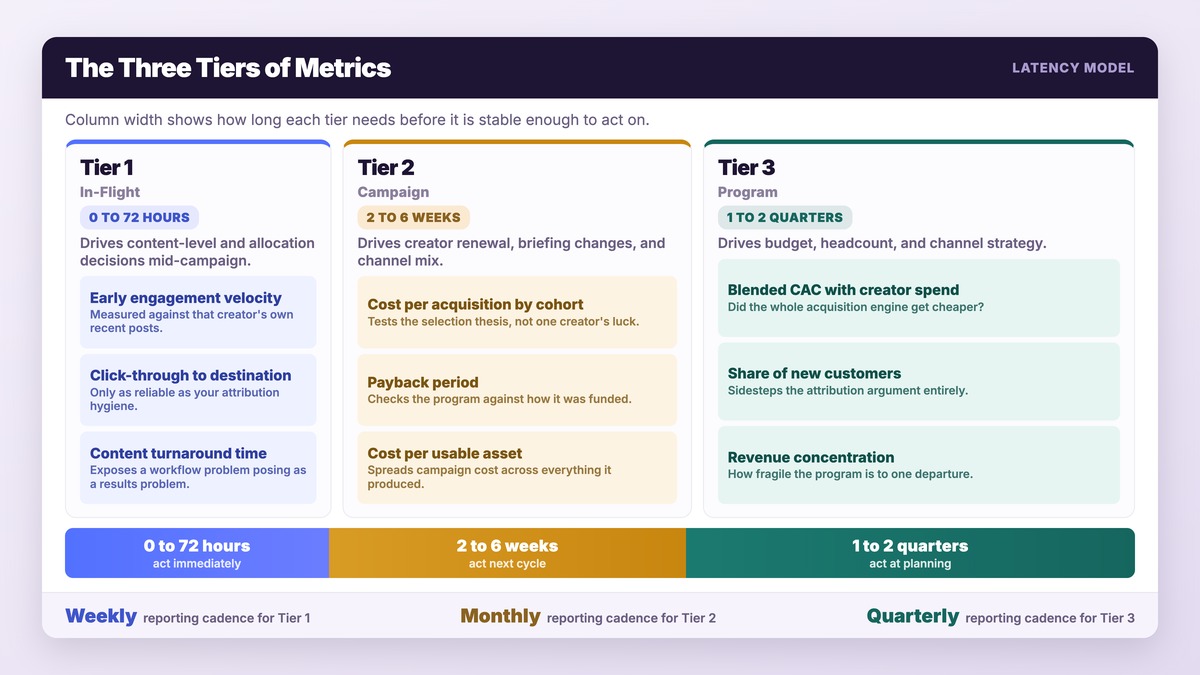
Sort every metric you currently track into one of three tiers, defined by how long the metric needs before it is stable enough to act on.
- Tier 1 — In-Flight (0 to 72 hours). Stabilizes almost immediately. Drives content-level and allocation decisions while the campaign is still running.
- Tier 2 — Campaign (2 to 6 weeks). Needs the full campaign arc plus a conversion window. Drives creator renewal, briefing changes, and channel mix.
- Tier 3 — Program (1 to 2 quarters). Needs multiple campaigns before the signal separates from noise. Drives budget, headcount, and channel strategy.
The tier assignment matters more than the metric name. The most common measurement error in creator marketing is not tracking the wrong metric — it is reading a Tier 3 metric on a Tier 1 schedule. Blended customer acquisition cost across a creator program is a legitimate, important number. Checked weekly, it will swing enough to justify almost any conclusion you already wanted to reach.
The tier test
To place a metric, ask one question: if this number moved 20% tomorrow, would I change anything?
- Yes, immediately → Tier 1. Give it a threshold and an owner.
- Yes, at the next planning cycle → Tier 2. Report it monthly, not weekly.
- No, I would wait to see if it holds → Tier 3. Report it quarterly, and stop putting it in weekly updates.
Most dashboards shrink by half the first time a team runs this test honestly.
Tier 1: In-Flight Metrics (Decisions Within 72 Hours)
Tier 1 metrics exist for one purpose: deciding where the next dollar and the next brief go while the campaign is still live. They are deliberately shallow. They are not trying to prove ROI — they are trying to catch a problem early enough to fix it.
Early engagement velocity
Not total engagement — the rate of engagement accumulation in the first hours after posting, compared against that specific creator’s own recent baseline. The comparison point is what makes it useful. Measuring a creator against a category average tells you about the category. Measuring them against their own last ten posts tells you whether this particular piece of content landed.
A post tracking well below a creator’s own baseline within the first day is a content problem, and it is the one Tier 1 signal that reliably justifies pausing paid amplification before you spend behind weak organic performance.
Click-through to landing destination
Clicks are a genuine Tier 1 signal because they stabilize fast and are unambiguous. The caveat is attribution hygiene. The IMH 2026 Benchmark Report found that 45.9% of brands use promo or discount codes for attribution measurement, 26% use affiliate links, and 25% use native shop features. Each mechanism has a different failure mode — codes get shared publicly, affiliate links break in bio tools, native shop data lives behind a platform wall. If your click data is not reconciled against the mechanism producing it, the number is not Tier 1 reliable.
Content approval and turnaround time
An operational metric that behaves like a performance metric. Creator content that arrives late gets posted outside the planned window, which distorts every downstream number and usually gets blamed on the creator rather than the process. Tracking turnaround exposes whether your measurement problem is actually a workflow problem.
This is where operational tooling changes the numbers directly. The partnrUP platform reports 40% higher creator response rates through automated, personalized outreach and 70% less time spent on internal coordination and admin — both of which move turnaround before they move performance.
What does not belong in Tier 1
- Conversion rate — the sample is too small in seventy-two hours to be stable
- Return on ad spend — the conversion window has not closed
- Sentiment — early comments skew toward a creator’s most engaged followers
- Cost per acquisition — meaningful only once spend has fully landed
Tier 2: Campaign Metrics (Decisions Between Campaigns)
Tier 2 is where most of the useful work happens. These metrics need the campaign to finish and the conversion window to close, which typically means two to six weeks. They answer the questions that shape the next campaign: which creators to renew, which briefs to rewrite, which channel to weight.
Cost per acquisition by creator cohort
Reported per individual creator, CPA is noisy — one creator’s numbers are usually built on too few conversions to be stable. Reported by cohort (follower tier, content format, category), it becomes one of the strongest signals in the program. Cohort-level CPA is what tells you whether your creator selection thesis is working, rather than whether one particular creator got lucky.
Payback period
Underused, and increasingly the number finance actually cares about. The IMH 2026 Benchmark Report found 65.9% of marketers expect payback within 1 month, and 48.4% within 2 weeks. Those are expectations rather than measured outcomes, which is exactly why measuring your real payback period is valuable — it is the fastest way to find out whether your program is performing against the assumption it was funded on.
Content efficiency: cost per usable asset
Creator campaigns produce assets that outlive the campaign. If content is being repurposed into paid social, email, or product pages, the campaign cost should be divided across every asset it generated, not just the organic posts. Teams that skip this systematically understate creator ROI. Our guide to content repurposing strategy for creator assets covers how to structure rights so this math is available to you at all.
Creator retention rate
The share of creators from the last campaign you chose to work with again. It is a quality signal disguised as an operations metric: a program that re-signs a healthy share of its roster has found a repeatable selection process. A program that rebuilds its roster every campaign is paying discovery costs indefinitely and never compounding creator familiarity with the brand.
Incremental conversion rate against a holdout
The hardest Tier 2 metric to run and the most valuable. Without a holdout, every conversion attributed to creator content includes customers who would have purchased regardless. Holdouts are operationally awkward — you have to deliberately withhold exposure from a comparable segment — but they are the only mechanism that separates influence from coincidence. For a fuller treatment of measurement designs that attempt this, see our analysis of brand lift studies for influencer marketing.
Tier 3: Program Metrics (Decisions at the Budget Level)
Tier 3 metrics need one to two quarters of accumulated campaigns. They are the numbers that belong in a budget conversation and nowhere else. Putting them in a weekly update is how teams end up relitigating strategy every seven days.
Blended CAC including creator spend
The number that answers whether the creator program made the whole acquisition engine cheaper. It requires creator spend to be integrated into total acquisition cost rather than sitting in a separate marketing line. When creator content is genuinely working, blended CAC falls even where creator-attributed CAC looks unremarkable — because creator content lifts the performance of paid channels running alongside it.
Share of new customers with creator touchpoints
A directional metric that sidesteps the attribution wars. Rather than assigning credit, it asks a simpler question: what proportion of new customers encountered creator content anywhere in their path? A rising share alongside stable or falling CAC is one of the cleanest program-health signals available.
Creator-sourced revenue concentration
What share of creator-driven revenue comes from your top handful of creators. High concentration means the program is a few relationships wearing a program’s clothing — and it is fragile in a specific, predictable way: one creator changing agencies can erase a quarter. Concentration is a risk metric, not a performance metric, and it should be reviewed as one.
Program contribution to owned audience growth
Creator programs feed email lists, SMS subscribers, and loyalty enrollment. These compound and are cheap to attribute because signup mechanisms carry source parameters natively. Teams building toward durable creator commerce should read our guide on building a creator commerce strategy from scratch for how this connects to the wider revenue system.
The Metrics Worth Retiring in 2026
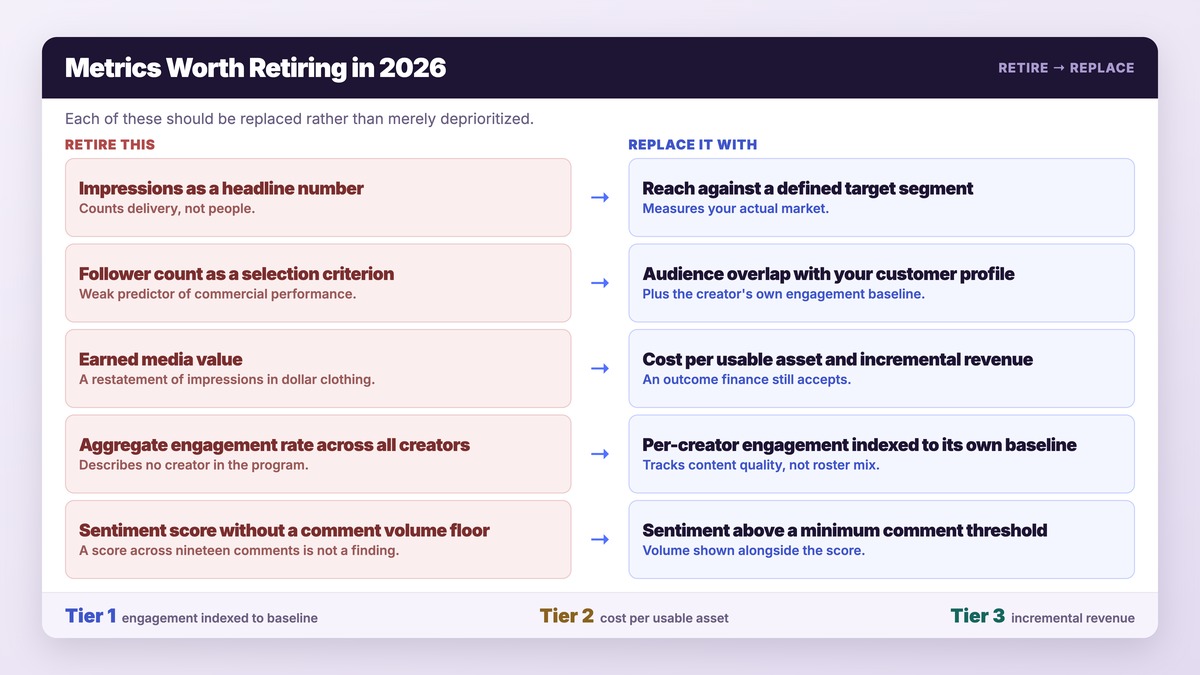
Some metrics survive in dashboards purely because they were there last year. Each of these should be replaced rather than merely deprioritized.
Impressions as a headline number
Replace with: reach against a defined target segment. Impressions count delivery, not people, and inflate with every algorithmic re-surface. A campaign can add millions of impressions without reaching a single additional person in your actual market.
Follower count as a selection criterion
Replace with: audience overlap with your customer profile, plus the creator’s own engagement baseline. Follower count has been a weak predictor of commercial performance for years, and selection tooling has moved well past it — our breakdown of how AI matches creators to brands beyond follower count covers what the stronger inputs are.
Earned media value
Replace with: cost per usable asset and incremental revenue. EMV converts organic performance into a hypothetical ad-spend equivalent using a multiplier the vendor chose. It is not an outcome; it is a restatement of impressions in dollar clothing, and finance teams have largely stopped accepting it.
Aggregate engagement rate across all creators
Replace with: per-creator engagement indexed against that creator’s own baseline. Averaging engagement rate across a roster of different follower tiers produces a number that describes no creator in the program. Smaller accounts pull the average up; larger ones pull it down; the composite tracks roster composition rather than content quality.
Sentiment score without a comment volume floor
Replace with: sentiment reported only above a minimum comment threshold, with the volume shown alongside. A 94% positive score across nineteen comments is not a finding.
Building a Metric Stack Your Team Will Actually Use
The best measurement framework is the one that still gets updated in month six. That constraint rules out most of what gets designed in planning workshops.
Cap each tier
Four Tier 1 metrics, five Tier 2, four Tier 3. Adding a metric requires removing one. The cap forces the prioritization conversation to happen once, deliberately, instead of never.
Give every metric a threshold and an owner before launch
Write down, in advance, the value that triggers action and the person who takes it. “CPA above X in a cohort for five consecutive days → reallocate to the next cohort → owned by the campaign lead.” A metric without this pair is reporting, not measurement.
Match reporting cadence to tier
Tier 1 weekly, Tier 2 monthly, Tier 3 quarterly. Resist the request to put everything in the weekly deck. The discipline of not reporting a Tier 3 metric weekly is what prevents quarter-scale decisions from being made on week-scale noise.
Instrument attribution before the campaign, not after
Codes, links, and native shop tracking each need to be in place at launch. Retrofitted attribution is reconstruction, and reconstruction always favors whichever channel was measured most aggressively. With 66.3% of programs running in-house, this instrumentation is your team’s job and nobody else’s.
Automate collection so analysis gets the time
Manual data pulls are the first thing dropped when a team gets busy, and dashboard decay is why frameworks quietly die. Only 10.56% of marketers report using no AI at all in their creator programs, per the IMH 2026 Benchmark — automated collection is now the norm rather than an advantage. Platforms like partnrUP consolidate creator discovery, campaign tracking, and payment into one system, with 100% creator payment accuracy and compliance, so the reporting layer is a by-product of running the program rather than a separate project.
Conclusion
The influencer marketing metrics that matter in 2026 are not a fixed list — they are whichever numbers are stable enough to trust at the moment you need to decide something. Sorting by decision latency fixes the most common measurement failures at once: it stops teams reacting to immature signals, it gives every metric a job, and it shrinks the dashboard to something maintainable.
Start by auditing what you track today against the tier test. Most teams find that a third of their dashboard drives no decision at all, and that the metrics genuinely used for budget conversations are being read on a weekly cadence they cannot support. Retire the first group, re-cadence the second, and the reporting problem largely resolves itself.
If your measurement problem is really a data-collection problem, see how the partnrUP platform handles tracking and attribution across creator campaigns, or book a demo to walk through your current metric stack with our team.
Frequently Asked Questions
What are the most important influencer marketing metrics to track in 2026?
The most important metrics depend on the decision you are making. For in-campaign decisions, track early engagement velocity against each creator’s own baseline, click-through to your landing destination, and content turnaround time. For between-campaign decisions, track cost per acquisition by creator cohort, payback period, cost per usable asset, and creator retention. For budget decisions, track blended CAC including creator spend and the share of new customers with a creator touchpoint. A metric that does not map to a specific decision does not belong in the dashboard.
How do I measure influencer marketing ROI accurately?
Accurate ROI requires instrumenting attribution before launch, not reconstructing it afterward. Use a consistent mechanism — promo codes, affiliate links, or native shop tracking — and reconcile the data against the mechanism’s known failure modes. Then divide total campaign investment across every asset produced, including content repurposed into other channels, rather than only the organic posts. Our step-by-step ROI formula guide covers the full calculation.
Is engagement rate still a useful influencer marketing metric?
Per-creator engagement rate indexed against that creator’s own recent baseline is useful and fast-stabilizing. Aggregate engagement rate averaged across an entire roster is not — it mostly tracks the follower-tier composition of your roster rather than content quality, because smaller accounts typically post higher rates than larger ones. Index individually; do not average across tiers.
How long should I wait before judging an influencer campaign?
It depends on the metric’s tier. In-flight signals such as engagement velocity and click-through are readable within seventy-two hours. Campaign-level metrics such as cost per acquisition and payback period need the campaign to finish plus a full conversion window, typically two to six weeks. Program-level metrics such as blended CAC need one to two quarters. Judging a program on a Tier 3 metric after four weeks is the most common way teams cancel campaigns that were working.
What is the difference between a vanity metric and a real metric?
A real metric has a pre-committed threshold and an owner who acts when it crosses that threshold. A vanity metric moves, gets reported, and changes nothing. Impressions, follower count, and earned media value are the most common examples in creator marketing — not because they are inaccurate, but because almost no team has defined what they would do differently if any of them changed.
Should I use brand awareness or revenue as my primary KPI?
Use whichever one your budget was approved on. The Influencer Marketing Hub 2026 Benchmark Report found brand awareness is the most-selected KPI at 55.1%, while revenue and sales KPIs are selected less frequently — which creates a gap when the program was funded on a revenue argument. If your business case was revenue, awareness metrics can support the story but cannot be the headline, because that mismatch is where creator budgets get cut in planning season.
How many metrics should an influencer marketing dashboard have?
Around a dozen, split across the three tiers — roughly four in-flight, five campaign-level, and four program-level. The specific numbers matter less than the cap itself: enforcing a fixed count means adding a metric requires removing one, which forces prioritization to happen deliberately. Uncapped dashboards grow until nobody maintains them, and an unmaintained dashboard is worse than a small one.